|
Investors Are Jumping and Sentiment Is High, Stocks Are Rich and Our Economy Is Humming
|
|
By:
Jeffrey A. Hirsch & Christopher Mistal
|
February 26, 2015
|
|
|
|
There are two basic types of market indicators: trending indicators and oscillating indicators. Trending indicators signal a move in the same direction such as On Balance Volume, where an increase in volume predicts an increase in price. Oscillating indicators or contrary indicators move inversely to an index, market or security. Sentiment indicators have been used as contrary indicators for years, but their efficacy has always been dubious.
Historically, when market sentiment has been extremely bullish it has preceded a top and a correction or bear market. Conversely, when sentiment is extremely bearish it has preceded a bottom and a rally or new bull market. The CBOE Equity Only Put/Call ratio is a contrary sentiment indicator we have used and tracked for years and is included in the Pulse of the Market below.
However, frankly, it has not been much use of late. The last time it spiked above 1.00, indicating more put buying than call buying (hence excessive fear in the market) was the week ending November 21, 2008. While this was nearly the low point of the market, the ultimate low came more than three months later in March 2009.
Investors Intelligence Advisors Sentiment has been a valuable contrary indicator over the years. So when this week’s numbers came out showing an uptick in the Bullish Advisors % to nearly 60%, the highest since last July, it was cause for concern. However, as illustrated in the charts below of the S&P 500 plotted against the Bullish and Bearish Advisors % it becomes quite clear that the usefulness of this indicator, at least in the near, has been lacking for years. The periods are broken into three to allow for the changes in price range for the S&P.
While a large percentage of bearish advisors in conjunction with a sharp spike have been more likely to accompany a bottom, large percentages of bulls even with sharp spikes have not marked a major top. Bullish sentiment can run quite high and for quite some time before a top is formed and a significant decline begins.
![[S&P 500 V. II % Bulls & Bears]](/UploadedImage/AIN_0315_20150226_Sentiment.jpg)
Ten years ago or more we had to wait for mail to be delivered and analysis to be reported to find out who was bullish and who was bearish. Now we know instantly on Twitter. So it’s no wonder everyone is often in agreement and the oscillating contrary sentiment indicators are merely following the trend of the market. Perhaps now that QE is done and rate hikes are imminent in the US these indicators may become relevant again. But until there is a clear sign that they are, we expect the market to continue higher as per our forecast with a high most likely in the first half of 2015 around Dow 19000, S&P 2250 and NASDAQ 5000, slightly higher or lower than NASDAQ’s all-time high, followed by a move sideways to slightly higher with volatility and corrections and an ultimate high near yearend 2015.
Pulse of the Market
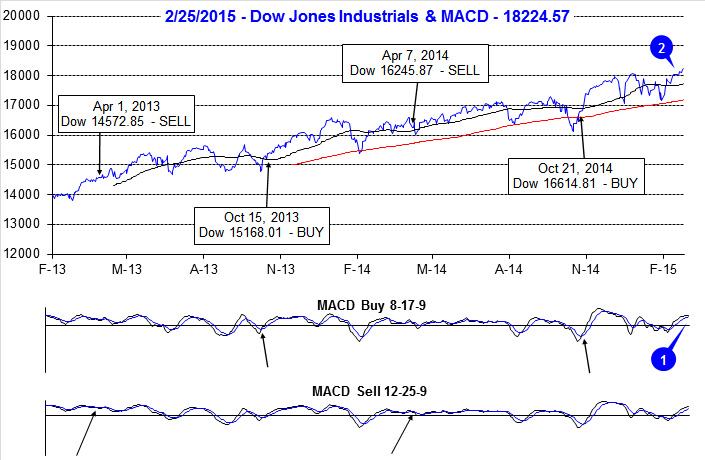
DJIA spent the vast majority of 2015 in the red until mid-February when it finally broke out above 18,000 to new all-time highs (1). The sprint off of late-January lows turned both the faster and slower MACD indicators positive at the start of February (2), but now that momentum has faded these indicators are on the verge of turning negative. The market’s resilience in the face of seemingly endless concerns about Greece’s fate, the standoff between the West and Russia over Ukraine and the growing threat of terrorism suggests underlying strength. And if DJIA can maintain its hold on 18,000, it will likely way find its way to our forecast first-half high of 19,000 in short order.
After starting the year off with four losing weeks out of five, DJIA has been up three straight weeks (3). However, traders are not as fully committed as some data suggests as this streak of winning weeks was accompanied by the second Down Friday/Down Monday (DF/DM) of 2015 (4). Historically, a DF/DM occurrence has been an early warning of weakness to come. This was certainly the case with the first of 2015 when DJIA dropped nearly 600 points from January 9 to January 30. Thus far, the second DF/DM of 2015 has been ignored.
S&P 500 (5) and NASDAQ (6) are also in the midst of a three week winning streak that is currently on its way to be four weeks. After nearly 15 years, NASDAQ is less than 100 points from a new all-time high. This time will be different. NASDAQ valuation metrics today are a far, far cry from what they were in 2000. A repeat of NASDAQ’s collapse at the start of the century is also substantially less likely.
The ratio of Weekly NYSE Advancers to Decliners (7) does not look as strong as the advance made by major indices in recent weeks. Normally this would be cause for concern, but commodities and related companies continue to struggle and are most likely responsible for the narrowing of this ratio. Some evidence of this can be seen in NYSE New Highs (8) for the week ending January 30. During that week, gold, silver and oil all peaked as major indices were hitting the lows of the year. Spiking commodities were boosting related companies then, but now that they are slumping again, New Highs are also falling.
Moody’s AAA Corporate Rate (9) bottomed at 3.36 at the end of January and has since moved higher with Treasury bond yields. Although corporate rates have climbed over 0.40 points in three weeks, they are still low by historical standards. Healthy, large-cap companies are still able to borrow cheaply to maintain or increase stock buybacks and dividends.