It’s nice to know so many folks are reading their trusty Stock Trader’s Almanac. The past two days our friends on financial news television have been championing the historical outperformance of the stock market in April and Q2, especially in the pre-election year, giving credence to our long-held belief and demonstration of the validity and value of historical seasonal and cyclical market patterns and trends.
But perhaps now that everyone is talking about these patterns on TV we should be more cautious. As the market rallied to new highs this month (except for NASDAQ – and
not on an inflation adjusted basis by a long shot) under increased volatility we have already begun to trim positions, tighten stops and take a more defensive posture.
And remember, that while April has been a banner month historically for the stock market and is likely to be solid in 2015 as well, it is the last month of the best six months. In fact, these past best six months have not been so stellar. DJIA and S&P are up less than 3% since October 31, though NASDAQ and Russell 2000 have done better, up 6.2% and 6.8% respectively at this writing. Not for nothing, but that’s rather weak for the 4-year cycle sweet spot and Best Six Months. This seasonal and cyclical underperformance is somewhat disconcerting. To wit:
“If the market does not rally, as it should during bullish seasonal periods, it is a sign that other forces are stronger and that when the seasonal period ends those forces will really have their say.” — Edson Gould (Stock market analyst, Findings & Forecasts, 1902-1987)
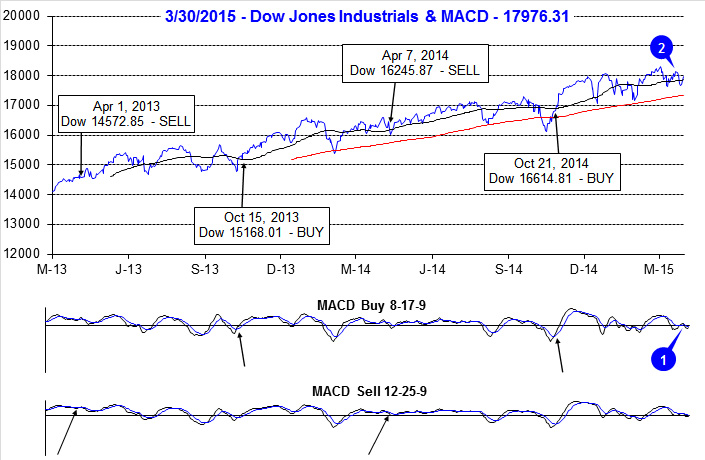
From our
October 21 Best Six Months Seasonal MACD Buy Signal the market is up more than double the gains from 10 days later. Now here we are on the eve of the last month of the Best Six Months with our reliable MACD indicators negative and falling as the market sells off into the close. On April 1 we begin to track MACD for our Best Six Months Seasonal Sell Signal. These days we look for MACD confirmation across the major indices as well as both the fast and slow MACD indicators. Currently it will take a gain of about 20 S&P points and 170 DJIA points for a Sell Signal NOT to trigger tomorrow.
However there is hope. The first two trading days of April are two of the more bullish days of the year, and they have been more bullish in recent years. As noted in the Stock Trader’s Almanac, in a multitude of places, first trading days and beginnings of months have a distinct bullish bias, but as the whole month is one of the best months of the year, its first two days are in the upper echelon as well.
As we track the end of the Best Six Months and our MACD Sell Signal and the market traces out the end of the 4-Year Cycle Sweet Spot in Pre-Election Q2, you may wish to consider logging some profits, trimming underperformers and getting positioned for a potentially volatile period during the Worst Six Months May-October. The Mideast is hot again and the mudslinging is about to begin in the 2016 Presidential race, which are bound to create nagging uncertainty for the stock market.
Pulse of the Market
As of yesterday’s close, both the faster and slower moving MACD indicators applied to DJIA (1) and S&P 500 were negative, but trending toward a new buy signal. Any modest gain today would turn the faster moving MACD Buy indicator positive for DJIA and S&P 500. The shift in momentum came after DJIA slipped below its 50-day moving average (2) for the second time in March. Perhaps anticipation of Q1 earnings season, beginning in April, can provide the catalyst for DJIA to break out of the trading range it appears to be stuck in since last November.
The first quarter of 2015 has turned out to be one filled with positive and negative weekly streaks. DJIA started off the year with four losing weeks out of five, followed by three straight weeks of gains and then it was down in four of the last five weeks (3). Even though losing weeks have outnumbered winning weeks, DJIA has managed to climb a modest 0.9% higher year-to-date at yesterday’s close. Over the past five weeks, buying the close on Friday and holding over the weekend as been a profitable trade four times (4). Traders and investors are clearly headline conscious however; most of the weekend news has turned out to be positive thus far.
S&P 500 (5) and NASDAQ (6) are also in the midst of comparable weekly losing streaks. Although NASDAQ has fared slightly better when it eked out a modest 0.2% advance during the week ending February 27 while DJIA and S&P 500 modestly declined. NASDAQ’s weekly close above 5000 (6) is the first time in the history of the Pulse (back to May 2001) and the first time since March 10, 2000. It only took 15 years, but technology’s growth has finally lived up to all the hype from then as earnings and thus valuations are at far more reasonable levels today than then.
The ratio of Weekly NYSE Advancers to Decliners (7) continues to show signs of troubled commodity sectors. Energy and precious metal related companies are a drag more often than not. As a result the NYSE Advance-Decline line has rolled over since February’s advance. This is a sign of a market that is likely range bound.
Two weeks ago the weekly CBOE Put/Call ratio at 0.48 sank to its lowest level since June 2014 (8) when it reached 0.47. Back then the market did top out and move sideways through July before pulling back in early August. Low readings like this are indicative of excessive bullishness which suggests traders and investors are either fully invested or awfully close.
Click for larger graphic…