Well, it looks like Santa Claus is coming to Wall Street. On the heels of a much sharper than typical correction in the first half of December, fueled by the cratering oil market and fears of another collapse of the Russian ruble, Janet Yellen, Chair of the Federal Reserve, delivered just what the market ordered. More upside follow through, or at least a decent day, tomorrow and we should be set for a typical (or even larger than average) Santa Claus Rally and higher highs by yearend or early January.
At that point, if the momentum stalls, look for the January break. January has been prone to profit taking selloffs in recent years. After any January/February correction the rally should resume, carrying us to new heights in the first half of 2015. While low oil prices may be a drag on energy producer margins it is quite bullish for the rest of the economy, the consumer and the market. As for Russia, this is not 1998. The situation is more contained and Putin himself warned of $40 oil today. Russia has half a trillion dollars in currency reserves and tons of gold it can use if things get tougher there. And besides the writing has been on the wall for quite some time so economic woes in Russia are no surprise.
With the market up over 2% today across the board it looks like we have put in a higher low than October and formed a nice “W” bottom with the August, October and December lows this week. So it appears that seasonality, technical analysis, fundamentals and economics have all come together at the moment. Market forecasting is a difficult and hazardous endeavor, but somebody has to do it and it’s a tradition we do every year at this time. So let’s look at some of the data.
Market cycles are aligned rather well for 2015. It’s a pre-presidential election year, the best year of the 4-year cycle. Since their last loss in 1939, the third year of the cycle is up 16.0% on average for the Dow and 16.3% for the S&P 500. Since 1971 NASDAQ averages a whopping 30.9% in the third year of the 4-year cycle. It is also the fifth year of the decade, which is also the best year of the decade with only one loss in the past thirteen decades. Years ending in “5” average 28.3% for the Dow and its predecessors since 1885, with S&P 500 averaging 25.3% since 1935 and NASDAQ averaging 25.6% since 1975.
We are also now firmly in the sweet spot of the 4-year cycle (midterm Q4 & pre-election Q1-2). These best three quarters of the 4-year cycle have produce averaged gains of 21.5% for the Dow and 22.2% for the S&P 500 since 1950 and 34.1% for NASDAQ since 1974. However, since 1901 there have been six previous presidents that have served a sixth and seventh year. Except for 1919 during the post-WWI-armistice rally, seventh years have been a little weaker than other pre-election years, likely due to lower excitement with a president the country has become disenchanted with.
Four Horsemen of the Economy
The Jobs market is in great shape with the Unemployment Rate in a steady downtrend and now below the Fed’s 6% threshold. After heading higher this fall Initial Jobless Claims have resumed their down trend. This shows continued improvement in the labor market. It is still tough out there for many, but the jobs market continues to improve.
Inflation is now dancing with the Fed’s 2% target level, but low oil and commodities prices are putting pressure on inflation. The end of QE has been digested nicely by the economy and market and with inflation still sanguine the Fed is not likely to crank up rates, maybe up to a flat 0.25% around midyear and then wait and see.
Consumer Confidence continues to trend higher and is now flirting with the critical 90 level and back at pre-recession levels. Despite a few frightful bumps the DJIA and the US stock market powers higher. Once we get into the end of Q1 and into Q2 and the Fed starts tightening we think the momentum will start to wane.
The Housing is doing better as well, but has stalled somewhat recently though at relatively healthy levels. Of the four key pieces of housing data we track: existing home sales, housing starts, new home sales and the NAHB HMI, new home sales is the laggard.
We believe the NAHB Housing Market Index (HMI) is the best indicator of the overall housing market – it led all the other indicators before the meltdown and recovered fastest. HMI is now above its midpoint line, which indicates that the housing market and the economy while settling down some are in good shape.
Existing home sales and Housing starts continue to trend higher though they have been consolidating. New home sales remain a concern struggling to pick up the pace. This will be the last indicator to turn, but will provide an important confirmation when the housing market, the economy and the market have entered the next secular boom.
Pulse of the Market
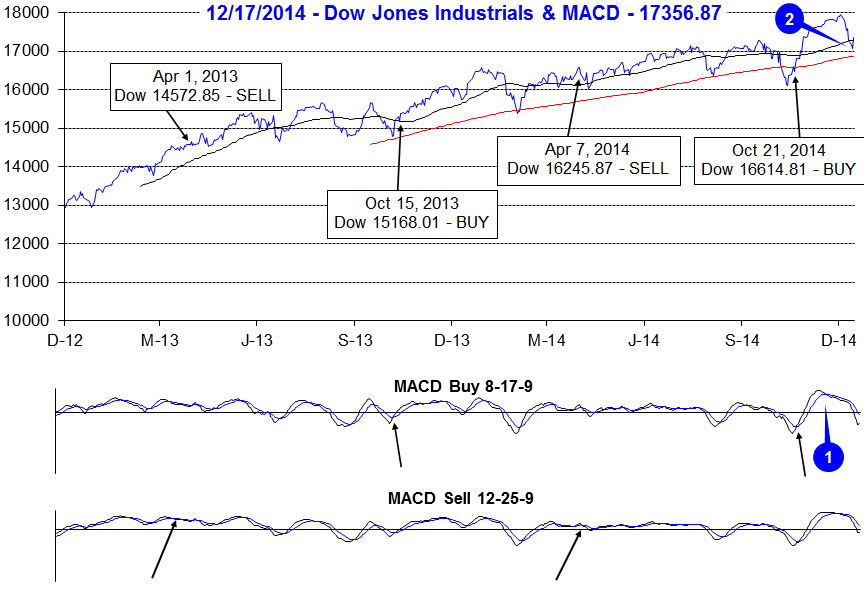
DJIA’s brisk, early fourth quarter rally, stalled just short of 18,000 in early December as plummeting oil prices began to weigh. DJIA’s faster moving MACD “Buy” indicator (1) signaled a loss of momentum in mid-November while the slower moving MACD “Sell” indicator did not confirm until late November. These early signals foreshadowed DJIA’s eventual retreat below its 50-day moving average (2). Should holiday cheer fail to lift the market, DJIA’s next support level is its 200-day moving average, currently just below 16,800.
Last week’s 3.8% DJIA decline (3) was its worst weekly loss since November 2011 and was capped off the following Monday by the seventh Down Friday/Down Monday (DF/DM) of 2014 (4). Historically, DF/DM’s have been ominous warnings. Since 2000, DJIA has registered 156 DF/DM occurrences, in all but five occasions; DJIA was lower sometime in the next 90 calendar days. However, this year’s DF/DM occurrences have tended to precede market reversals within days or at longest three weeks.
Last week’s losses also ended a seven week winning streak for DJIA (3) and S&P 500 (5). NASDAQ had suffered a minor loss during the previous week (6), ending its streak at six. The velocity and magnitude of the declines was greater than usual early-December weakness, but it looks like the market has found support mid-month and is poised to rally into yearend.
Early signs of the decline were also present in the ratio of Weekly NYSE Advancers to Weekly NYSE Decliners (7). During the week ending December 5, NYSE Decliners modestly outnumbered NYSE Advancers even as DJIA and S&P 500 recorded gains. When this occurs it typically indicates that a rally is beginning to run out of steam as fewer and fewer stocks participate. However, last week’s trading resulted in a heavily biased ratio towards NYSE Decliners, which possibly signals the worst of the decline could be over. Weekly CBOE Put/Call Ratio (8) also spiked up to levels last seen during mid-October. This spike indicates a dramatic shift in sentiment and also the possibility of a bottom.
One positive from last week’s losses was the sudden drop in Moody’s AAA Corporate Rate (9). At 3.75%, this is the lowest since May 2013. At least AAA-rated companies will be able to borrow cheaply keeping stock buybacks and dividend increases on the rise, both of which have generally been bullish for the market.
Click for larger graphic…
2015 Forecast
The end of quantitative easy, a plunge in the price of oil and several geopolitical and exogenous issues seem to have been shrugged off by this market. We expect the usual 50% move from the midterm low to the pre-election year high to be below average in the 20-30% range as Fed rates hikes loom large. Toward the later part of 2015 the economy is prone to slowing as Republicans and Democrats begin the next battle for the White House.
We expect a high most likely in the first half of 2015 around Dow 19000, S&P 2250 and NASDAQ 5000, slightly higher or lower than NASDAQ’s all-time high. Then we look for a move sideways to slightly higher throughout the last half of 2015 with an ultimate high near yearend 2015.
Happy Holidays & Happy New Year, we wish you all a healthy and prosperous 2015!