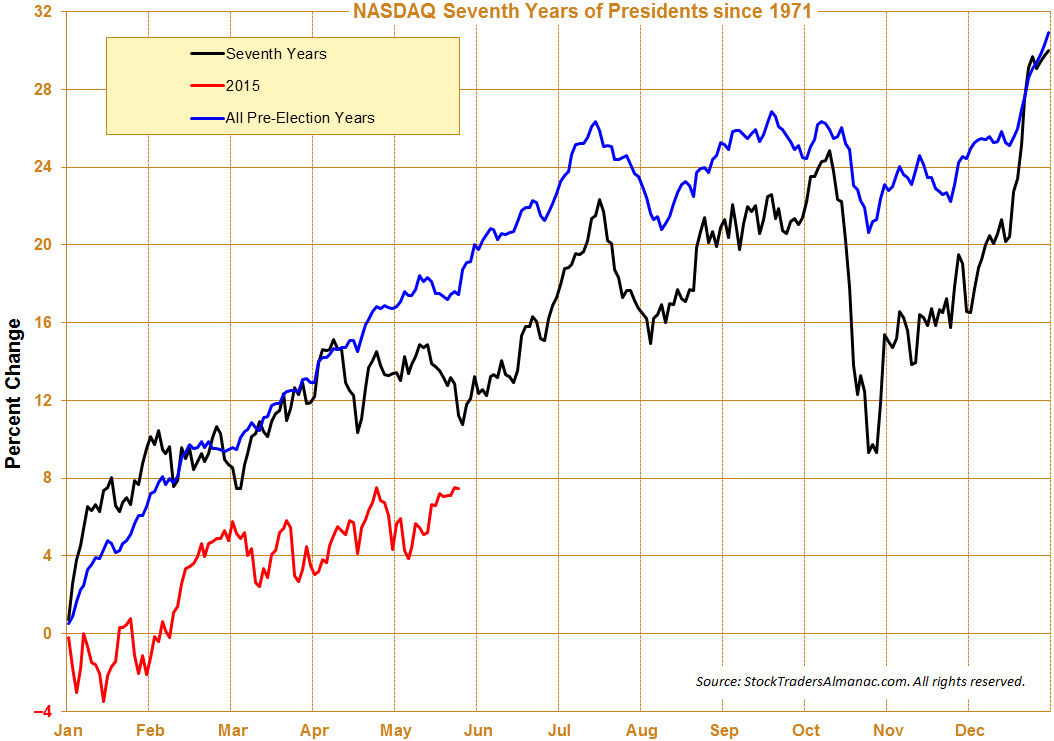
Stocks have not sold off in May this year and that of course has brought out the naysayers who are still not convinced of the validity, efficacy and value of market seasonality, cycles and recurring patterns. While the market is having a rather impressive May, stocks have made little headway this spring. As you can see in the graphs NASDAQ is the leader up 1% from its March high. S&P comes in a weak second, up 0.2% from the early March high. DJIA is off almost 1% and the Russell 2000 is lagging, down more than 1%. It’s not surprising that the NAS is leading heading into June, which is the last of NASDAQ’s Best 8 Months.
May’s gains have many thinking this means that “Sell in May” or the Worst Six Months as we call it are not to be feared. Not so fast. Yesterday on the blog we showed that S&P 500 gains
less than 1% June-October on average following gains in pre-election year Mays since 1950. That is certainly a mouthful, but the point is just because May is up, it does not mean that the Worst Six Months will be great. In the modern, post-WWII era from 1950 to present, the odds are nearly 50/50 that June through October will produce an average gain of just 0.87% this year. (See the blog for more details.)
Even with May’s DJIA gain of about 1.8% at yesterday’s close it is still lagging the typical pre-election year as well as the typically weaker 7th year of presidential terms – the second pre-election year of a two-term president. As many of you have chimed in on this phenomenon and appear to be tracking this with us we have updated the graph. As has been the case for the year so far, DJIA remains behind the historical average pre-election year pattern. Market-leading
NASDAQ lags even further behind.
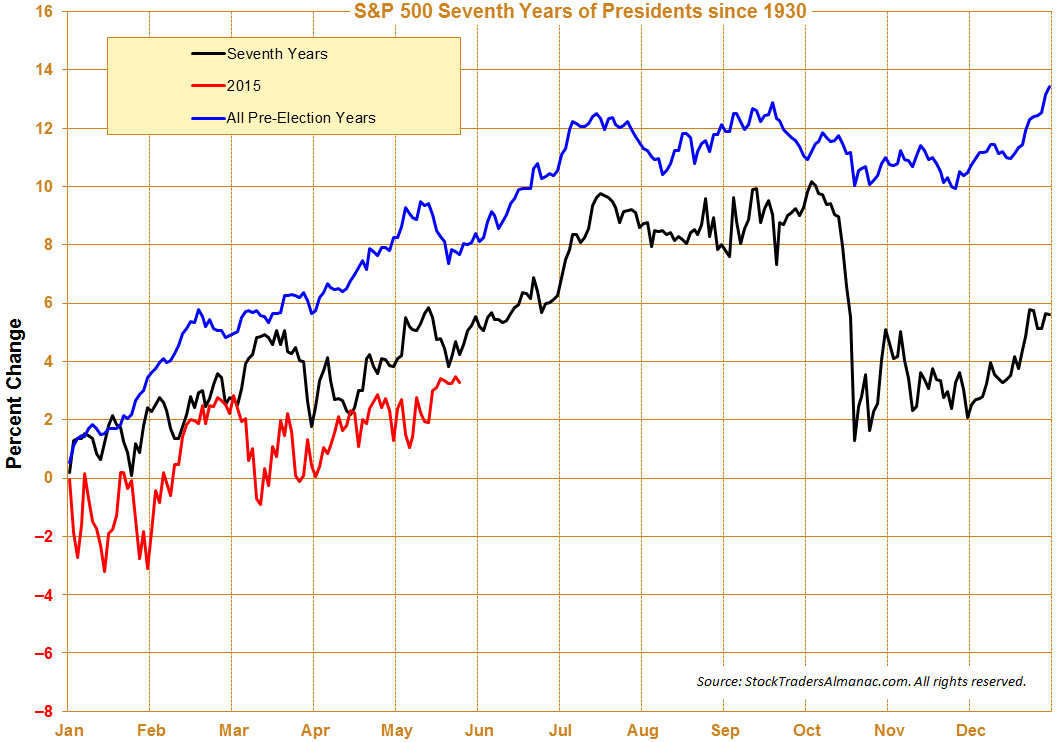
This lagging performance supports our other analysis that the market is getting more prone to a correction some time during the Worst Six Months. Whether we pullback in June or later in the typical August-October dry patch remains to be seen. We may leak higher, but further upside is becoming less likely and harder to come by. The Greek sovereign debt saga and the big headwind from Fed’s highly-anticipated first rate hike since June 2006, plus mixed economic data and seasonal forces are like to catalyze a market pullback. We do not expect anything sinister, but the long-averted 10% correction, give or take a few percentage points is quite likely.
As we enter June keep a few things in mind. While June improves in pre-election years the last two, 2007 and 2011, were down across the board. However, the first trading has been rather strong. Gains have been scant for the rest of the month until the last few days when NASDAQ and Russell 2000 perk up and begin to outperform as we hit the end of their Best 8 Months. Be mindful of the week after Triple- Witching, the week of the June 22-26. It has been nasty with Dow losses in 22 of the last 25 years with average losses of 1.1%.
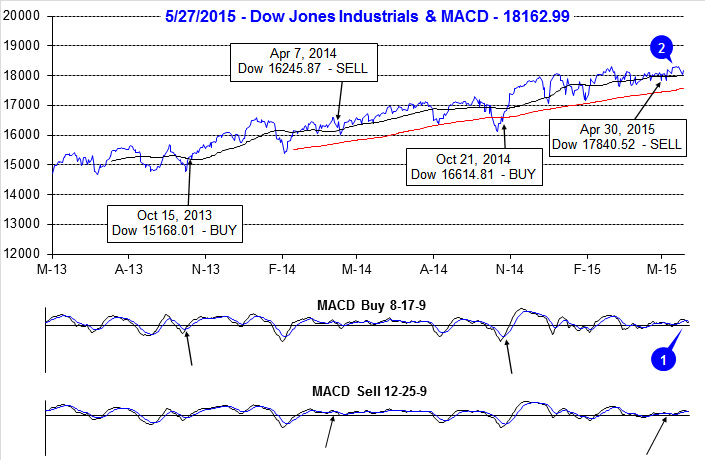
When we issue our Best 8 Months Seasonal MACD Sell Signal, which can occur June 1 or later, we will sell or tighten stops on any remaining related positions and adjust our defense. Stick to the game plan over the weaker summer months as the market looks toppy. It’s just fine to sit in some cash while we await the next fatter pitch. Continue to limit new longs and weed out underperformers. Consider some of the downside protection and short ideas in the ETF Portfolios.
Pulse of the Market
Since issuing our Seasonal MACD Sell signal for DJIA and S&P 500 on the close on April 30, the market has made a meager attempt at breaking out of its trading range. DJIA’s modest bounce higher did result in new all-time highs, just a few handfuls of points higher than its March highs (2). The bounce was accompanied by an improvement in both the faster and slower moving MACD indicators, but now that momentum has faded, both MACD indicators are now negative again (1).
After advancing two weeks in a row, DJIA came under pressure the week before Memorial Day. Selling the day before the three-day weekend was then followed by even heavier selling on Tuesday, triggering the third Down Friday/Down Monday (DF/DM) warning of 2015 (3). DJIA did bounce and recover some of the decline on Wednesday, but weakness has returned. Recent DF/DM occurrences have been followed by relatively mild declines of 2-4% magnitude. This week’s DF/DM coming so soon after new all-times highs could deviate from this pattern. For starters, the Fed is no longer aggressively supporting the market and second, past DF/DM’s near tops proved to be a major inflection point that eventually lead to a meaningful decline sometime during the following 90 calendars days.
S&P 500 has been the best index over the past eight weeks with just two weekly losses (4) compared to three for DJIA and four for NASDAQ (5). DJIA, S&P 500 and NASDAQ are trying to get back in sync like they were earlier in the year however; the Russell 2000, Transport and Utility indices are all still struggling. Absent broad participation, the most recent breakout attempt will most likely end up failing.
Further signs of a divergent and confused overall market can be seen in the number of NYSE Weekly Advancers and Decliners (6). Last week’s gains by S&P 500 and NASDAQ were accomplished with a greater number of declining stocks than advancing. Those gains are suspect. Further compounding concerns is the meager number of New NYSE Highs (7) and the sudden jump in New NYSE Lows. A healthy market advance would have major indices moving higher, together, more Weekly Advancers than Decliners and a more robust number of New Highs.
A potential buying opportunity appears to unfolding in some corporate bonds. Mainly Moody’s AAA bonds (8) as the recent squirt higher by stocks has sent their yield back above 4%. At 4.07%, this is the highest reading since last September and likely has some Fed rate hike fear already build into it.
Click for larger graphic…