|
Mid-Month Update: Mid-August to Election Day
|
|
By:
Christopher Mistal
|
August 16, 2016
|
|
|
|
At roughly the half-way point of August, the eleventh trading day of the month and yesterday’s close, DJIA was up 1.11%, S&P 500 0.76%, NASDAQ 1.94% and Russell 2000 1.80%. Some of these month-to-date gains were surrendered today, but the market is tracking August’s historical pattern in election years quite closely. As you can see in the following two charts, election-year Augusts follow a different pattern than all Augusts.
Election-year Augusts tend to start strong and remain in positive territory for the duration of the month while all Augusts over the most recent 21-year period have opened weak, bounced mid-month and finish in the red. In election years, around mid-month, NASDAQ and Russell 2000 tend to pull away from DJIA and S&P 500 to finish with an average gain of around 3%.
According to
Investor Intelligence Advisors Sentiment survey, bullish sentiment has been on the rise with the markets and is nearing lofty levels, but it is still not as frothy as it was, for as long as it was at the market’s top in May 2015. Bullish advisors were reported at 54.3% most recently compared to 59.5% in early 2015. Bears have retreated to just 20.9% and the correction camp is down to 24.8%. Bullish sentiment is elevated, but it has not reached truly worrisome levels yet which leaves plenty of room for the market to resume its advance in August.
Mid-August to Election Day Performance
Since 1950, the period from mid-August to Election Day in all years has a slightly bullish bias. DJIA and S&P 500 have advanced approximately 60% of the time with average gains of 0.3% and 1.0% respectively. This is actually rather impressive considering the propensity for market declines in August and September. But, since this time span also includes October, the month where numerous bear markets have ended and the subsequent rebound, it is actually not all that surprising.
However, in presidential-election years, the span from mid-August to Election Day over the same time period becomes somewhat mixed. With 2008 in the stats (and 2000 for NASDAQ), average gains shrink considerably with DJIA and NASDAQ posting average losses. The percentage of advances does increase for NASDAQ and Russell 2000. When 2008 is excluded from the stats there is a solid increase in average performance. DJIA jumps to an average gain of 0.8%, S&P 500 climbs to 1.6%, NASDAQ 2.2% and Russell 2000 3.8%.
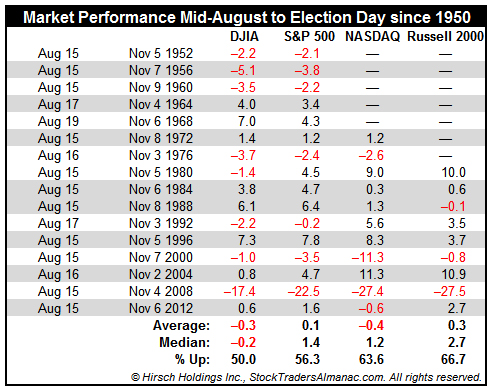
In the years that incumbent parties were victorious (shaded in grey), average performance improves nicely. Were it not for 1956, NASDAQ in 2012 and Russell 2000 in 1988, the record would have been perfect. When the incumbent party won, DJIA was up 2.4%, S&P 500 3.2%, NASDAQ 3.6% and Russell 2000 3.6% between mid-August and Election Day. With recent polls suggesting the Democrats are increasingly likely to maintain control of the White House, similar gains this year are also increasingly possible.