After finally breaking above Dow 20,000 for three days the market has retreated in supposed response to a string of executive orders signed by President Trump. The implementation of the temporary immigration ban on a few select countries created some waves and news, but net-net the S&P 500 is down a mere 0.8% since its January 25th high.
This was nowhere near enough of a selloff to derail the first positive January Barometer and January Indicator Trifecta in 4 years. The last time this transpired in post-election year 2013 the S&P 500 posted a full-year gain of 29.6%, including a February-December gain of 23.4%
Devised by Yale Hirsch in 1972, the January Barometer has registered eight major errors since 1950 for an 87.9% accuracy ratio. This indicator adheres to propensity that as the S&P 500 goes in January, so goes the year. Of the eight major errors Vietnam affected 1966 and 1968. 1982 saw the start of a major bull market in August. Two January rate cuts and 9/11 affected 2001.The market in January 2003 was held down by the anticipation of military action in Iraq. The second worst bear market since 1900 ended in March of 2009 and Federal Reserve intervention influenced 2010 and 2014. Including the eight flat years yields a .758 batting average.
Our January Indicator Trifecta combines the Santa Claus Rally, the First Five Days Early Warning System and the full-month January Barometer. The predicative power of the three is considerably greater than any of them alone; we have been rather impressed by its forecasting prowess. This is the 28th time since 1949 that all three January Indicators have been positive. As we detailed in the “
Proving Grounds” last week this is rather constructive. The following one-year seasonal pattern charts show some bang up performance in post-election years with a positive January Indicator Trifecta.
Despite the recent barrage of executive orders out of the White House and the uproar in the media, the market has help up rather well. So at this point, we are therefore not making any adjustments to our
2017 Outlook and Forecast. Looking past all the noise and rhetoric, what has happened so far in Washington has not yet had a meaningful impact on the economy.
Pulse of the Market
After repeated attempts throughout December and January, DJIA finally punched through and closed above 20,000 on January 25, 2017 (1). This purely psychological level has little technical meaning, but nice big round numbers do make nice headlines and apparently nice targets for profit taking. DJIA spent just three trading days above 20,000 and has come under pressure this week.
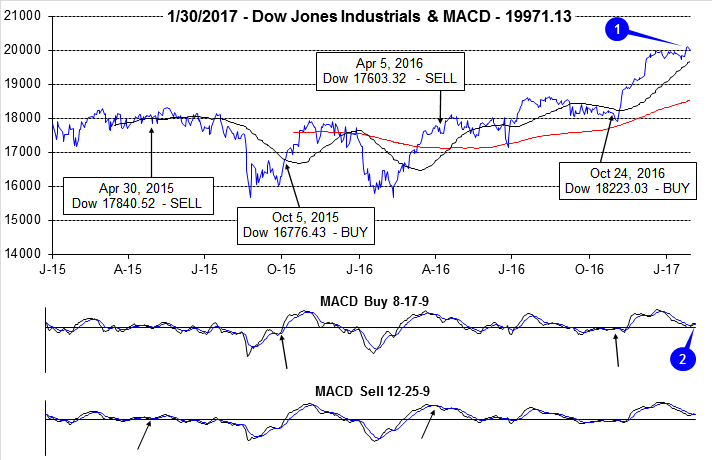
DJIA’s thrust above 20,000 was sufficient to turn its faster moving MACD indicator positive (2), but this signal is already beginning to fade. The slower moving MACD indicator turned positive last Friday and was quickly reversed by yesterday’s losses. The post-election rally appears to be taking another breather.
Following seven straight weeks of gains, DJIA (3) has slipped in three of the last five weeks. Mid-month declines were mild at less than 0.4% per week during week endings January 13 and 20. In the middle of this mild weekly losing streak, DJIA logged its first Down Friday/Down Monday (DF/DM) of 2017 (4). A second DF/DM was completed yesterday. Historically, DF/DM occurrences have been followed by further declines sometime within the next 90 calendar days. Losses sometimes occurred immediately while other times, DJIA bounced before retreating. A DF/DM to close out January, ahead of frequently challenging February, (the worst month in post-election years) warrants close monitoring.
S&P 500 (5) appears to be unable to catch a break. It gets pulled down when DJIA is weak and only captures a portion of NASDAQ’s strength (6). It did close at new all-time highs last week with the assistance of technology shares, but on a year-to-date basis is still lagging NASDAQ. At yesterday’s close, S&P 500 was up 1.9% year-to-date compared to NASDAQ’s 4.3%.
NYSE Weekly Advancers and Decliners (7) continue to behave largely as expected. Weekly advancers are robust when the major indices advance and tepid when they decline. However, last week’s Advancers were somewhat light considering the new all-time highs reached. Fewer stocks participating in the rally is a sign that the rally could be stalling. This certainly appears to be the case thus far this week.
NYSE Weekly New Highs (8) appear to have peaked in the first half of December. This is also a somewhat of a concern as it appears to support Weekly Advance/Decline numbers in confirming that new all-time highs are being made by fewer and fewer stocks. NYSE Weekly New Lows have remained subdued which does alleviate some of the concern, but not of all of it. If New Lows were to begin to expand meaningfully, the pause could become a more detrimental pullback.
Weekly CBOE Put/Call (9) has crept higher since mid-December. Weekly readings in the 0.60 to 0.70 range have been largely neutral. This is neither excessively bullish nor excessively bearish which offers little insight into the markets next move alone. Based upon all readings and weak February seasonal factors, a mild pullback appears most likely in the immediate future.
Click for larger graphic…