As the market is finally making rally attempt at the end of April, the last month of the Best Six Months” we are obligated to remind you that the “Worst Six Months” are now upon us, and as we pointed out last month this bearish seasonal stretch has been
more pronounced in midterm years.
For the near term over the next several weeks the rally may have some legs. But as we get into the summer doldrums and the midterm election campaign battlefront becomes more engaged, we expect the market to soften further during the weakest two quarter stretch in the 4-year cycle. However, this can set up a quintessential Midterm Election Year Bottom Picker’s Paradise.
While everything may seem extremely troublesome in the market right now, please remember that the Best Six Months still remain positive with the Dow and the S&P up about 4% since the close of October 2017 and we still have the positive January Indicator Trifecta. When the Worst Six Months get underway and after we issue our Sell Signal we will prepare you and help you position your portfolio to weather the weak patch and prepare for the next buying opportunity.
Best Six Months MACD Sell Signal Update
There has
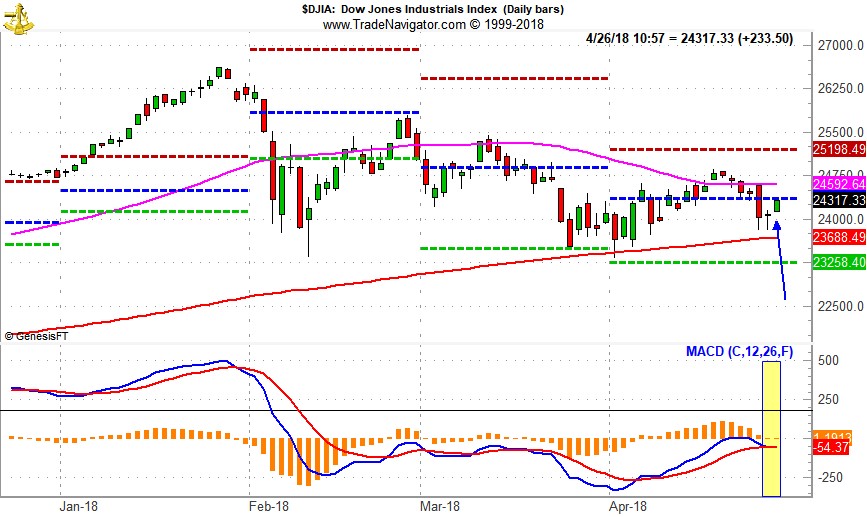
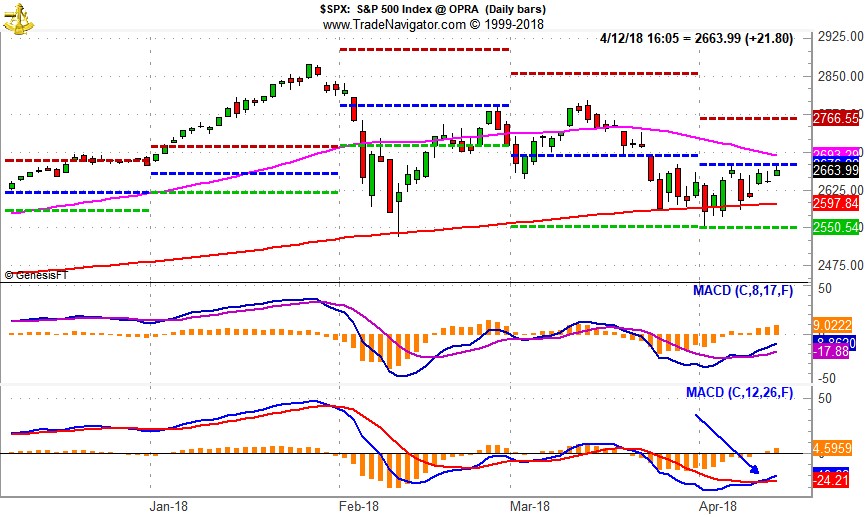
NOT been a Sell Signal yet. Tuesday’s selloff did cause some damage but the S&P Sell MACD indicator stayed positive and today rally firmed it up further. We will issue our Seasonal MACD Sell signal when corresponding MACD “sell” indicators applied to DJIA and S&P 500 both crossover and issue a new sell signals. At this juncture the market is poised for a bounce and rally, so for now
continue to hold long positions associated with DJIA’s and S&P 500’s “Best Six Months.”
When both the DJIA and S&P 500 MACD Sell indicators trigger a sell signal, we will issue an Almanac Investor Alert. We will either outright sell specific positions or implement tight trailing stop losses. Bearish/defensive positions in: iShares 7-10 Year Treasury (IEF), iShares 20+ Year Treasury (TLT), SPDR Gold (GLD), ProShares Short Dow 30 (DOG), ProShares Short S&P 500 (SH) and/or other protective strategies may also be considered. All stock and ETF holdings will be evaluated at that time. ETFs providing exposure to sector seasonalities ending in May and June along with underperforming stocks in the Almanac Investor Stock Portfolio may be sold at that time as well.
Pulse of the Market
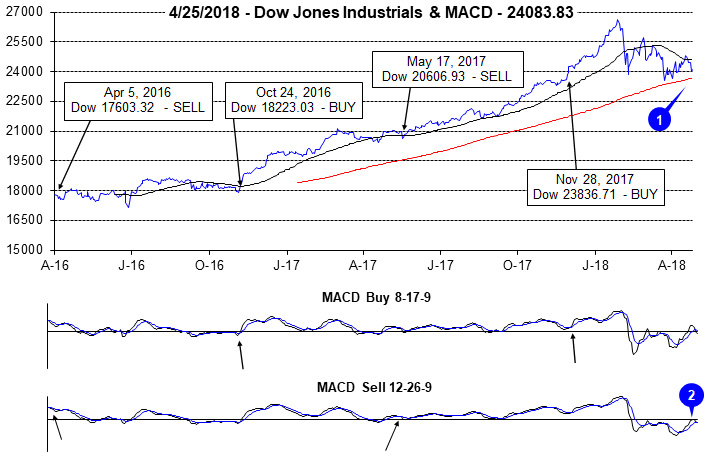
Historical precedents held true this April with weaker performance in the midterm year than all years. But all things considered in the new normal volatility, stocks held up rather well in the face of the tumultuous geopolitical and financial news flow. DJIA once again found support just above its 200-day moving average (1). The big decline last this past Tuesday pushed both the faster and slower moving MACD indicators applied to DJIA into marginally negative territory (2). This brought us to the brink of a Best Six Months MACD Seasonal Sell Signal, but the S&P 500 MACD Sell Indicator remained positive.
The Down Friday, Down Monday registered this week (3) preceded the big selloff Tuesday which ended up so far as a turning point. It’s as if traders knew that the peak earnings fears would come to a head Tuesday. S&P 500 (4) and NASDAQ (5) managed to put up a modest gain last week along with DJIA, indicating some broad-based strength. Today’s rally trimmed this week’s losses and follow through tomorrow bring the week into the plus column and posting a gain on a Friday would be near-term bullish.
NYSE Weekly Advancers outnumbered Weekly Decliners (6) by 1.5 to 1. Not super impressive, but any positive breadth is encouraging. We’ll need to see improvement in market breadth for any rally to gain traction.
New Highs and New Lows (7) were also very tight last week, nearly dead even. More highs than lows are positive as is the slight trend up in new highs, but lows are also on the rise. Market internals are really not that encouraging right now and if we do not seem improvement here than the market is more likely to succumb to headline risk and seasonal weakness.
After peaking in late February, the yield on the 30-year Treasury bond meandered lower, but began to rise again last week (8). The resumption in the rise in rates is likely a reflection of the steady, but decelerating growth in the economy and corporate America, modest pace of rising inflation and measured pace or rate increases by the Fed.
Click image to view full size…