Fed Chairman Powell and President Trump have been competing for who can freak the market out most. Our contention for months has been that the Fed is the biggest risk to the market and economy and that surely seems to have come home to roost the past few months and this week.
Last month in our “Market at a Glance” we said that, “
After nearly a decade at zero, a brief pause to evaluate the impact of recent hikes does not seem unreasonable.” In addition to the continuing rate hikes is the impact of the Fed’s quantitative tightening program of reducing its balance sheet, which is equivalent to another ¼ or ½ point on the Fed Funds rate. We have not been the only ones saying this and perhaps Stanley Druckenmiller said it best in his
Wall Street Journal piece last weekend.
And in the face of this market selloff Chairman Powell refused to relent and pause to reflect. Perhaps he’s playing hardball with President Trump and wants to prove the Fed’s independence or perhaps he is just determined to raise rates as much as he can while the “labor market has continued to strengthen and” “economic activity has been rising at a strong rate,” in the Fed’s own words from the 12/19/18 FOMC Statement.
Either way his comments at Wednesday’s news conference that he expects to raise rates 2 more times in 2019, while the Fed’s growth forecasts for 2019 and beyond are for slower growth were not what the market wanted to here. Quarter point now and a pause to reflect would have been music to Wall Street’s ears.
President Trump’s own games of hardball with the Democrats over the “wall” and the funding bill to keep the federal government open and the Chinese over fair trade continue to spook the market. The market’s performance thus far in Q4 has been the exact opposite of historical averages. Higher interest rates, trade disputes and Brexit all appear to be weighing on the market. Tougher corporate earnings comparisons and slowing earnings growth are also hindering the market.
When the U.S.-China trade negotiations take a step in a positive direction and the Fed has toned down some of its more hawkish rhetoric the market will be free to rally. It would take one impressive rally to put Q4 back in the black, but there is still time for a more modest yearend rally that could return DJIA and S&P 500 to a positive full-year performance or at least bring Santa Claus to Wall Street.
Technically the market is broken. As we warned on our blog Monday we were
flirting with disaster and now that all three major U.S. market indices have violated the early 2018 lows more selling is probable as there is little support below them. Next levels of support are found way back at the August 2017 lows around Dow 21700, S&P 2425 and NASDAQ 6200.
Additionally, volatility has not spiked that high and the selling has been rather orderly with little of the panic that is present at market bottoms.
So as we wind down this year of the return to volatility and more historically normal market action (2017 was an anomaly) our outlook is tempered, at least for the next several weeks and early 2019. If our Santa Claus Rally can materialize that would be the first constructive sign, if not, we would expect more volatility.
Midterm Correction Sets Stage
The tax cut legislation held off the usual midterm year correction until much later in the year, pushing the potential low toward yearend and into 2019. But this bodes well for pre-election year 2019. If the market had kept chugging along to new highs, gains in 2019 would have been harder to come by.
Now that we have a sizeable correction and likely a bit more downside in store, 2019 is setting up better than it was at the beginning of October. If the market can find support soon or early in 2019, the Fed comes to its senses and the folks in D.C. can cut some deals more normal pre-election year gains can be expected.
The third year of the 4-year presidential election cycle is still the strongest and now with the market hitting new 52-week lows the stage is set. For perspective have a look at the average 1-year seasonal patterns for the Dow, S&P 500 and NASDAQ in the chart below.
Four Horseman of the Economy
Lead horseman DJIA along with the rest of the market has definitely come up lame since early October, but the longer term uptrend remains intact. However, as mentioned above we have a technical breakdown on the charts that brings the August 2017 lows into play. Next levels after that are the spring 2017 lows then yearend 2016 levels.
Consumer confidence is still strong, but further market declines could easily take the wind out of the consumer’s sails. Corporate investments are still in full force with billions of dollars of spending planned, but if the economy-driving consumer gets cold feet growth rates are likely to slow.
The Fed’s statutory mandate from Congress to “promote effectively the goals of maximum employment, stable prices and moderate long-term interest rates,” appears to be in check. The Unemployment Rate continues to remain super low at 3.7%. Economic activity is strong and prices remain stable.
Our inflation horseman as measured by our 6-month exponential moving average calculation on the CPI and PPI is has been rising steadily into that healthy level with the CPI just over 2% at 2.43% up from 1.98% last year at this time. PPI is now at 4.31% up nearly a full percentage point from last year’s 3.49% level, but down a notch from last month’s 4.59% level.
2018 Forecast Recap
The three-case forecast we presented last year was:
- Worst Case – 5% chance. Full blown midterm bear market caused by North Korea actually setting off a nuke, no positive impact from tax reform, or some other doomsday scenario.
- Base Case – 47.5% chance. Above average midterm year gains in the range of 8-15%, a mild worst six correction or pullback.
- Best Case – 47.5% chance. Everything pans out, tax reform juices corporate earnings, bonuses & paychecks grow, economy grows. DJIA 29,000, S&P 3,300, NASDAQ 9,800
The small chance we gave the doomsday scenario did not pan out. While stocks have sold off a chunk here, this is not a full-blown bear market at this point. Our best case scenario also did not pan out. But our base case was not that far off. Instead of getting a correction during the bulk of the worst six months and the 8-15% gains by yearend, we got 8-15% gains by early October and an October-December correction.
Pulse of the Market
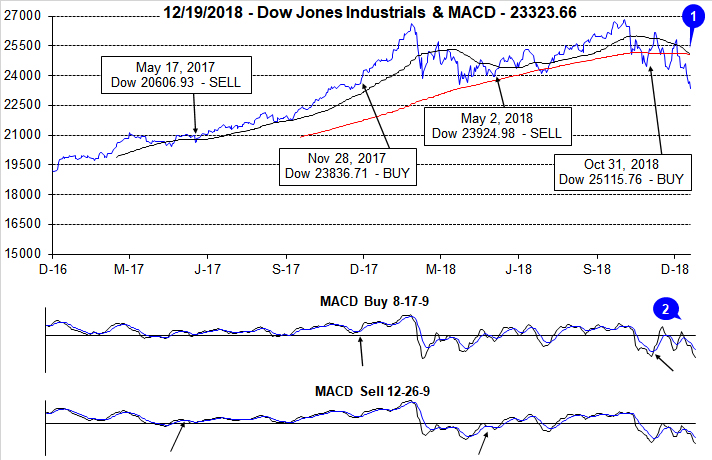
Thus far there has been nothing magical about Q4 2018. At today’s close, DJIA is down 13.6% for the quarter. This is DJIA’s worst Q4 since 2008 when it declined 19.1% and its eighth worst Q4 going back to 1901. DJIA has sunk below its 50- and 200-day moving averages and a death cross has formed on its chart (1). A death cross occurs when the 50-day moving averages crosses through the 200-day moving average. Since 1982, the majority of DJIA death crosses were not accompanied by any major subsequent decline. Faster and slower moving MACD indicators applied to DJIA are currently negative and below the “zero” line (2). This is indicative of a market that is or is approaching oversold conditions.
Mid-month December has historically been a choppy time for DJIA and that has been especially true this year with only a single day of strength on the first trading day and frequent daily declines following. On Monday, December 17, DJIA completed its thirteenth Down Friday/Down Monday (DF/DM) of 2018 (3). The longer-term track record for DF/DM occurrences is ominous, with declines frequently taking place sometime in the next 90 calendar days. However, they have also occurred at some significant inflection points near interim bottoms. With DJIA, S&P 500 (4) and NASDAQ (5) all declining in four of the past five weeks a rebound is a possibility.
Market breath measured by NYSE Weekly Advancers and NYSE Weekly Decliners was last positive during the final week of November and turned decidedly negative over the last two weeks (6). However, the ratio of decliners to advancers has yet to reach the extreme levels of 6-10 decliners per one advancer that transpired near recent lows in February 2018 or February 2016.
Weekly New Highs and New Lows reacted as one would expect during a steady retreat. New Lows (7) have ballooned to their highest level since February 2016 while New Highs remain subdued. A sustained trend of expanding highs and shrinking lows would be an encouraging sign that the selloff could have reached a climax.
90-day Treasury rate continued to climb (8) reaching 2.38% last week ahead of the anticipated Fed interest rate hike while the 30-year Treasury rate continues to decline on slowing global growth prospects. Market-based interest rates appear to be telling the Fed to take a breather on further hikes as the Treasury yield curve continues to flatten while 2-year yields are already exceeding 5-year yields (inversion).
Click for larger graphic…
2019 Forecast
There is an increasing probability that we are in a bear market right now in the U.S. And if the U.S. market continues to behave as it has for the last few months, we could be down 20% on the Dow and S&P 500 soon or in early 2019. The NASDAQ was down 20% intraday from its highs today and the Russell 2000 is already down 23.8% as of today’s close from its 2018 high
Taking into account the risks of heightened volatility, increasingly bearish sentiment, a more tepid fundamental outlook, a persistently hawkish Fed, an embattled Federal government as well as the bullish history of pre-election year markets and historical seasonal patterns we have once again laid out three scenarios for next year:
- Worst Case – Prolonged bear market caused by hawkish Fed, dysfunctional Federal Government, slow growth and weak corporate fundamentals brings us all the way back to November 2016 pre-Trump election levels or lower. Repeat of pre-election year 2015 with the bear lasting throughout 2019 into 2020.
- Base Case – Something gives. Mild bear market bottoms soon or in early 2019 as Fed tones down rhetoric and holds off raising rates, Trump and the Dems work out a few deals and we have modest pre-election year gains in the 5-10% range.
- Best Case – Everything resolves quickly. Fed becomes accommodative. Trade deals are worked out expeditiously. Trump tacks towards the center and works with congress and does not get “Muellered.” Typical pre-election year gains of 10-15% for Dow and S&P 500 and 20-30% for NASDAQ
We will be keeping you fully abreast of all readings from out three January Trifecta Indicators: Santa Claus Rally, First Five Days and the full-month January Barometer and will make adjustments on the close of January 2019.
Happy Holidays & Happy New Year, we wish you all a healthy and prosperous 2019!