Since Christmas the market has ripped higher on supportive market internals, still solid overall fundamentals and improving technicals. In line with our Seasonal Market Probability Calendar (graphically represented on page 20 of the
Stock Trader’s Almanac 2019 in the “February Almanac” and
here on the blog) the market succumbed to usual February weakness after the first few days of the month and again around the Presidents’ Day holiday and again today on the usually bearish last trading day of the month.
The two yellow boxes in the chart highlight the seasonal weak spots mentioned above from the 4th-7th trading days of February, around Presidents’ Day and on the last trading day of the month. After diving through the August 2017 low support level and then springing back up through it on Christmas, the market paused at the February 2018 low resistance level and again at the October-November 2018 lows that were blown out in December. Now that we have cleared the 200- and 50-Day Moving Averages we have the aforementioned November high at 2815 to clear before we can attack new all-time highs.
![[S&P Chart]](/UploadedImage/AIN_0319_20190228_S&P_Resistance.jpg)
We don’t expect to take out the old high so fast. More likely we will dance around this 2815-level for a few months. Early March strength should push us above this level, but then end-of-March weakness is likely to retest this level again. Provided we avoid any unexpected geopolitical snafus the all-time highs could be tested in Q2 and perhaps exceeded, followed by backing and filling in Q3. Then we expect the market to make another run at new highs in the 4th quarter where many Pre-Election Year highs have been logged over the years.
Overall our outlook remains positive. Seasonal indicators are strong with our January Indicator Trifecta positive 3-for-3 and the Best Six Months back in the black up about 3% across the board after a wild ride at the end of 2018. The market has impressively digested the dynamic news flow so far this year and a look at the “Pulse” below highlights a much improved market internal environment. NYSE Advance-Decline made new highs recently illustrating the broad participation in the rally.
There will be bumps and volatility this year, most likely around the end of March and during the Worst Four Months July-October. But in the end we expect solid gains for 2019.
Pulse of the Market
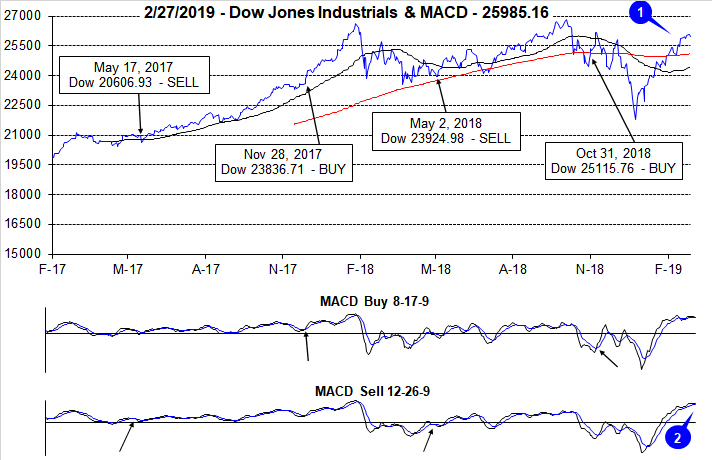
DJIA’s advance off the December bottom continued in February with better than average pre-election year gains (1). DJIA has reclaimed its 200-day moving average (solid red line in top chart) and its 50-day moving average is also heading higher. If DJIA’s 50-day moving average continues to climb, it will eventually cross back above the 200-day moving average to form a bullish golden cross. The pace of gains did slow when compared to January’s move which is reflected in both the faster and slower moving MACD indicators (2). Due to this slowing in momentum the faster moving MACD indicator turned negative yesterday. The slower moving MACD “Sell” indicator however, is still positive.
Another DJIA Dow Friday/Down Monday (DF/DM) did occur in early February (3), but much like the early January occurrence there has yet to be any meaningful follow through on this historically bearish sign. DJIA and NASDAQ (5) have extended their weekly winning streaks to nine straight. S&P 500 has been up in eight of the past nine weeks (4). The last time DJIA recorded a streak of nine or more straight weekly gains was in 1995 and there have only been
twelve other streaks of nine or more straight weeks since 1901. When these streaks end, it is usually followed by a brief period of consolidation, but after a month or so the rally has usually resumed.
Market breath measured by NYSE Weekly Advancers and NYSE Weekly Decliners has been bullish since late December with Advancers outnumbering Decliners by wide margins in eight of the last nine weeks (6). As a result, the NYSE cumulative advance/decline line is now higher than it was last September when the market was making new all-time highs. This is a bullish sign that suggests further market gains are probably.
Bullishly, New Weekly Highs have slowly been expanding while New Weekly Lows have remained subdued (7). As the rally continues and the market climbs closer to its previous highs, New Weekly Highs should continue to increase in number.
Consistent with recent commentary from FOMC members, short- and long-term interest rates (8) have stabilized. The 90-day Treasury rate has ticked slightly higher to 2.41 but is not expected to make any major move higher while the 30-year Treasury has remained right around 3.00% for the last ten weeks.
Click for larger graphic…