February is notoriously the weak link in “Best Six Months” so we expect the big run the market has been on since mid-October to at least take a breather in February as it often does to consolidate January gains and the gains over the first half of the “Best Six Months.” The market is also digesting a copious and volatile news flow, still elevated valuations and some consolidating technical readings.
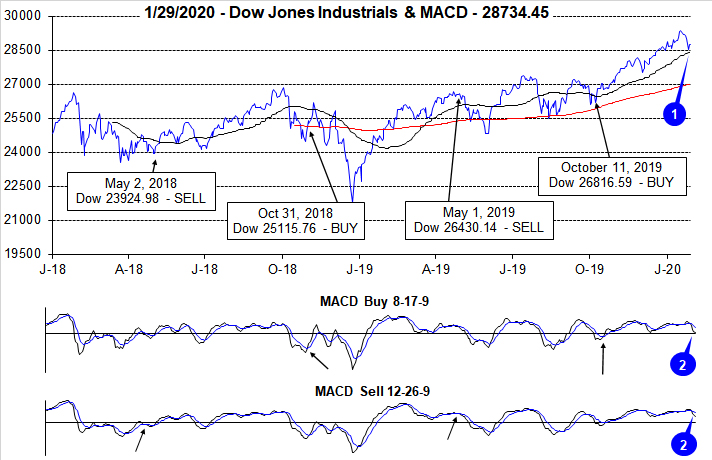
Since our October 11, 2019 “Best Six/Eight Months” buy signal DJIA is up 7.6%, S&P 500 has gained 10.6% and NASDAQ has tacked on an impressive 15.4%. The only thing that seems to have been able to rattle this bull market at all in 2020 has been the spread of China’s coronavirus and the quarantines and travel restrictions associated with it.
However, the market has proved to be resistant, suffering a mere 2.6% drop on the S&P 500 from the January 17 high to the low so far on Monday January 27. All the damage came over two days, creating the first Down Friday/Down Monday of 2020. We examined
how epidemics have impacted the market on the blog and found that historically the market has not been greatly affected by these outbreaks.
In other news, stocks also appear to be immune to presidential impeachment trials and Brexit. This likely has much to do with Fed and the Election Cycle. The Fed is still printing lots of money and they are likely to continue to do so for some time. At the last FOMC meeting the said they had plans to continue adding liquidity to the banking repo market through April. This is basically QE4 and we suspect it the will continue well past April as banks continue to rely on the repo facility and have become accustomed to having it. An expanding Fed balance sheet is something that has been known to fuel bull markets.
In addition to this expanding Fed balance sheet the Trump administration appears to be engaging in some classic Election Year priming of the pump. Government spending has been increasing under President Trump and this massive deficit spending is running at a faster pace than last year. Federal spending for the first quarter of Fiscal 2020 ending December 2019 came in at $1.163 trillion up from $1.090 last year with a deficit for the quarter of $357 billion vs. $319 billion last year. Cleary the current administration is ramping up spending in its reelection year in typical incumbent fashion.
Finally, our flagship
January Barometer indicator is on pace to be positive unless the S&P 500 is down more than 52.88 points (–1.6%) tomorrow on January 31. This bodes well for the market in 2020. When the January Barometer has been positive in Election Years the market has been up for the year 100% of the time for an average gain of 15.6% and gained 10.6% over the remaining 11 months.
We would also hit our
January Indicator Trifecta, as the Santa Claus rally and First Five Days have already posted gains. The previous 31 occurrences of positive January Indicator Trifectas have been followed by full-year S&P 500 gains 28 times with average gains of 17.5% and gains over the next 11 months 27 times averaging 12.3%. This suggests that our base case and best case scenarios in our
2020 Annual Forecast from December 19, 2019 are on track.
Pulse of the Market
DJIA closed above the 29,000 milestone on January 15. Along the climb higher the Santa Claus Rally and the First Five Days indicator were also positive putting the market on course to complete the historically bullish January Trifecta. The march higher in January did encounter some bumps and dips, but DJIA has held and remained above its 50-day moving average (1) thus far. The global spread of China’s coronavirus is high on the list of concerns as its potential impact on growth and corporate earnings is unknown, but now that it has been officially declared an emergency by WHO, additional funding and a firmer, more aggressive response is likely. Due to the recent retreat by DJIA, both the faster and slower moving MACD indicators (2) are currently negative.
Earlier this week DJIA recorded its first
Down Friday/Down Monday (DF/DM) of the year (3). Given the historical record of DF/DMs since 2000, it would be prudent to remember that the majority of past occurrences were followed by some weakness during the next 90 calendar days. However, if DJIA’s Monday close of 28535.80 holds and DJIA quickly recovers to 29000 and/or above, then the likelihood of a more damaging retreat in the near-term is diminished.
Looking back over the last 20 weeks, S&P 500 (4) has risen in fourteen weeks; NASDAQ (5) has advanced in fifteen weeks. S&P 500 worst weekly decline was a modest 1% last week and in late September. Even NASDAQ’s 2.2% decline in September was not all that damaging. Week after week of modest gains combined with only the occasional modest pullback is evidence of a resilient market with reasonable strong underpinnings.
Market breadth measured by NYSE Weekly Advancers and NYSE Weekly Decliners (6) has remained positive with Weekly Advancers outnumbering Weekly Decliners by respectable amounts in positive weeks. Weeks where Decliners outnumber Advancers and the major indexes post a modest advance would be a concern as this could be an early indication that participation is fading and only a handful of the largest stocks are carrying the market.
Weekly New Highs may have peaked at 631, two weeks ago (7) consistent with new all-time highs by DJIA, S&P 500 and NASDAQ. That was the largest number of New Weekly Highs since December 2016. Weekly New Lows have remained subdued but have been slowly creeping higher over the past four weeks. The market’s next move will determine where these levels go from here.
CBOE Weekly Put/Call Ratio sunk as low as 0.47 last week (8). This was the lowest reading since June 2014. In the week since, the ratio has snapped back to a neutral level. If the ratio were to retreat back below 0.50 again, it would be a concern as it could foreshadow another mild retreat at a minimum.
Click for larger graphic…