This July has commenced with across the board gains from the major indexes, DJIA, S&P 500, NASDAQ, Russell 1000 and Russell 2000. Today’s gains are consistent with historical trends for the first trading day of July. Over the past twenty-one years, July has on average begun with respectable gains. The second trading day has been weaker, but after this the major indexes have tended to trend solidly higher through mid-month to around the thirteenth trading day. At this point the major indexes have tended to weaken and trade sideways to lower to finish out the month.
July Sector Seasonalities
Three new sector seasonalities begin in the month of July. First up is a bearish seasonality in Transports which typically begins in the middle of July and lasts until the middle of October. This seasonality is based upon the Dow Jones Transportation index (DJT). Over the last 5-, 10- and 15-year time periods DJT has declined 2.4%, 3.2% and 4.2% on average during this weak timeframe. Industrials also exhibit similar weakness as the transports sector over nearly the same time period.
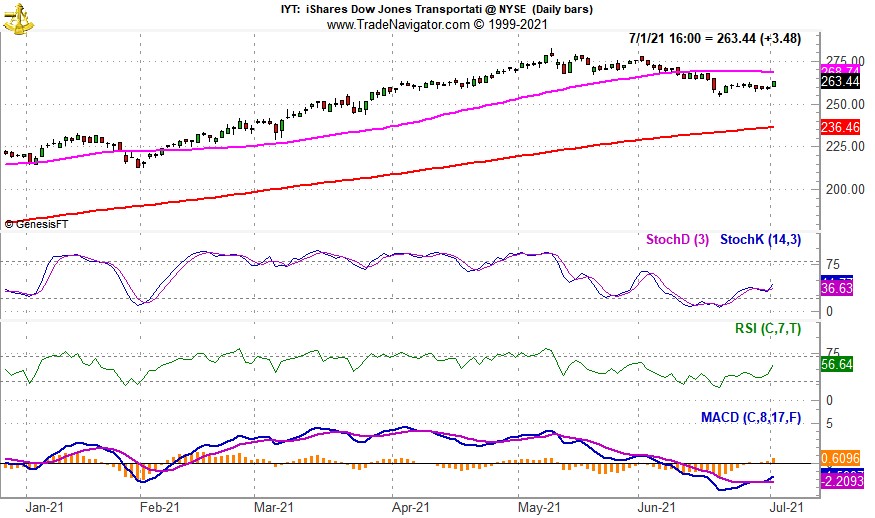
iShares Transportation (IYT) is a top choice to establish a short position in to take advantage of seasonal weakness in the transport sector. IYT has over $2 billion in assets, has traded an average of over 250,000 shares per day over the past 30 days and has a reasonable 0.42% expense ratio. IYT’s top five holdings include: FedEx, Kansas City Southern, Norfolk Southern, Union Pacific, and United Parcel Service.
]
IYT appears to have peaked in the first half of May. It has been trending lower since and slipped below its 50-day moving average in the first half of June. Currently, Stochastic, relative strength and MACD indicators are beginning to turn, but it could be a false indication like what transpired in early June. IYT could be shorted near resistance around $268.73 or a breakdown below $255. If shorted, set an initial stop loss at $280.00, this level is just below the intra-day high in early May.
SPDR Industrials (XLI) will be our choice to establish a short position in to trade seasonal weakness in the industrial sector. XLI has over $19 billion in assets and frequently has over 10 million shares changing hands daily. Its expense ratio of 0.12% is very reasonable. Top five holdings include: Honeywell, United Parcel Services, Union Pacific, Boeing, and Raytheon Tech.
XLI’s chart and technical indicators do not differ much from the chart of IYT. XLI peaked around the same time as IYT and currently is trying to reclaim its 50-day moving average. XLI could be shorted near resistance around $103.50 or on a breakdown below $99.50. If shorted, set an initial stop loss at $106.00, this level is just above the intra-day high in early June’s failed breakout.
July’s final seasonality is from gold & silver mining stocks. This seasonality is based upon strength in the Philadelphia Gold & Silver index that typically begins in late July and lasts until late December. Over the last five years this trade has not been that successful however, over the last fifteen years the trade has averaged 4.7%. A three-pronged approach to this trade can be taken. In addition to a long positions in SPDR Gold (GLD) and iShares Silver (SLV) a position in VanEck Vectors Gold Miners (GDX) position is also suggested.
GDX had a tough June dropping from early month highs near $40 to less than $34. Relative strength, Stochastic and MACD indicators appear to be on the verge of turning positive. GDX could be considered near current levels up to a buy limit of $34.25. If purchased an initial stop loss at $32.54 is suggested. Take profits if GDX trades above $39.45.
SPDR Gold (GLD) and iShares Silver (SLV) are current holdings in the Sector Rotation ETF Portfolio. Additional purchases and/or new purchases could be considered on dips below a buy limit of $165.00 for GLD and $24.00 for SLV. We will maintain existing stop losses in the table below.
Sector Rotation ETF Portfolio Updates
With the exception of the trade ideas presented above, the balance of the Sector Rotation Portfolio is on Hold. Global X Copper Miners (COPX) and United States Copper (CPER) were both stopped out in mid-June. In the previous update stop losses for COPX and CPER had been raised as seasonal strength in copper historically has ended in May to early June. That is what appears to have transpired again this year. The average gain for the two positions was 25.3% excluding any trading costs or dividends.
With tight stop losses in place, SPDR Consumer Discretionary (XLY) and iShares DJ US Tech (IYW) moved higher throughout the month of June. XLY was up 17.3% at yesterday’s close while IYW was up 22%. XLY and IYW remain on Hold and their respective stop losses have been adjusted for recent gains.
Tactical Seasonal Switching ETF Portfolio Updates
As of today’s close, NASDAQ’s Seasonal MACD Sell has NOT triggered. Continue to Hold Invesco QQQ (QQQ). For NASDAQ’s Seasonal MACD to turn negative it would take a one-day decline of at 362.54 points (2.50%).
Defensive bond positions, AGG and BND, have firmed modestly since last update, but both can still be considered on dips below their respective buy limits. Headline inflation numbers have been elevated and well above the Fed’s target, but we generally agree that this is a transitory spike due to the economic shutdown last year. Moderating Treasury bond yields appear to confirm this.