Our outlook for the full year remains clearly bullish, more in line with the best cast scenario of our
Annual Forecast made last December. S&P 500 is already up 17.7% so far this year at 4419.15. Our updated outlook is for S&P 500 to finish the year in the 4500-4600 range or even higher, but we do anticipate the rally to pause over the next 2-3 months during the worst two months of the year.
For the past 33 years from 1988-2020 August and September are the worst two months of the year for DJIA, S&P 500 and NASDAQ. August is the worst for DJIA and S&P 500 and September is worst for NASDAQ. August is up only 18 of the past 33 years for DJIA and S&P 500 with average losses of -0.8% and -0.6% respectively. NASDAQ is a bit better in August up 19 of 33 years with an average gain of +0.2%.
September actually has more losses for the Dow (up only 16 of 33, average -0.5%) and S&P (up 17 of 33, average -0.3%). NASDAQ has been up 20 of 33 Septembers with an average loss of -0.1%. The average losses are not huge but the trend of volatility is consistent with a plethora of sizable drops, most notably in August 2015, 2013, 2011, 2010, 2001, 1998, 1997, 1992 and 1990 and in September 2020, 2015, 2011, 2008, 2002, 2001, 2000 and 1990.
Bullish forces continue to persist. The Fed remains easy and accommodative. More fiscal stimulus is likely from Washington as Congress nears finalizing the deals on infrastructure and spending. Economic readings remain robust, but Q2 GDP was below expectations. Q2 earnings season has been rather stellar, but Q3 comps will not be as easy. This Covid-19 Delta variant is a concern and poses a threat to the bull and the economic expansion. Political wrangling here in The States and geopolitical machinations around world could also knock the market off course momentarily.
Despite the persistence and resilience of this bull rally market internals and technicals are showing some signs of fatigue. Advancing issues have barely outpaced decliners in recent weeks. New highs have been shrinking while new lows remain high. Technical indicators are still struggling to break through resistance with Relative Strength, Stochastics and MACD breaking down again.
In addition to the exogenous threats from Covid, U.S. politics, geopolitics, internals and technicals, the timing of a pause coincides with the weak seasonal patterns mentioned above during the worst months of the year August and September (not to mention Octoberphobia) as well as the 4-Year Presidential Election Cycle.
As you can see in the chart here of the Modern 4-Year Presidential Election Cycle indicated by the black arrow we are due for a pause over the next couple of months before the rally resumes in the September/October timeframe. This illustration of the average 4-year cycle uses the S&P 500 back to 1949, which is the first full cycle post-WWII vs. other comparisons that use the Dow back 125 years to 1896.
This more recent dataset is a better representation of the modern cycle where post-election years have been better and election years weaker – impacted by the undecided election in 2000 and the financial crisis of 2008. Midterm years are still lackluster with propensity for the significant bottoms and pre-election years are still the tops.
This creates the sweet spot of the 4-year cycle from Q4 in the midterm year through Q2 in the pre-election year. From the midterm low to the pre-election year high DJIA averages a 45% gain since 1950 and NASDAQ averages a 70% gain since 1974.
The recent gains are impressive and hard to resist, but history tells us that it is prudent to be cautious at this time of year. We believe it is the best course of action to sit tight, be patient and use the time to reposition your portfolio for the August/September summer doldrums and prepare to pounce on our next Best 6/8 Months Buy Signal for the yearend rally.
Perhaps it’s anecdotal, but the continuing market rally and the new highs since last month caused us to recalibrate the vertical axis scale on our DJIA & MACD chart below. It may be mere coincidence, but every time we’ve had to raise the top end of the scale it has been just prior to a rally pause and pullback.
Pulse of the Market
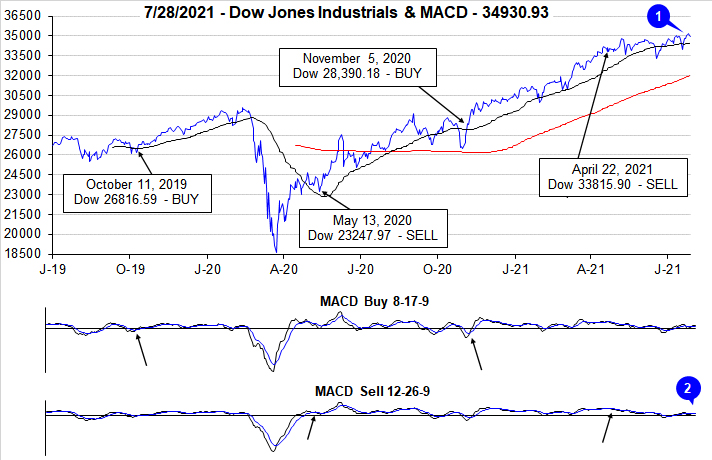
For the first time in its history, DJIA (1) closed above 35,000 last Friday, July 23. Other than being a nice, round number there does not appear to be any other major significance from this level. It is interesting to note that DJIA was less than 1% from eclipsing this level in early May and it took over two months to finally break through it. From 35,000, DJIA is now less than 11% away from our Super Boom forecast from May 2010 of DJIA 38,820 by 2025. DJIA’s jump above 35,000 was also sufficient to turn both its faster and slower moving MACD indicators positive (2) after a brief extent of being negative that commenced just after mid-July.
That mid-July weakness also triggered the second Down Friday/Down Monday (DF/DM) of 2021 (3). Historically,
DF/DM occurrences have been observed around or near market inflection points, but most frequently have foreshadowed market weakness. Research has shown that when DJIA has recovered quickly from the DF/DM losses, further near-term weakness has usually been avoided. Thus far, the most recent occurrence appears to fall into this category as DJIA has quickly rebounded.
Another wave of rising Covid-19 cases appears to have triggered renewed interest in mega-cap tech stocks. After declining for four straight weeks in late-April and early May, NASDAQ (5) has advanced in eight of the last ten weeks. Tech-heavy S&P 500 (4) has also benefited climbing in seven of the last nine weeks. Solid Q2 earnings reports have also supported the major indexes.
In spite of general market strength over the last five weeks, market breadth measured by NYSE Weekly Advancers and NYSE Weekly Decliners (6) has been rather tepid over the past four weeks. Last week’s numbers are a disappointment considering the magnitude of the weekly gains logged by S&P 500 and NASDAQ with Weekly Advancers only narrowly exceeding Weekly Decliners. If this week’s numbers improve that would be encouraging. Absent a meaningful improvement this week there could be new weakness in August and/or possibly beyond.
The trend of Weekly New Highs (7) is also worrisome as they continue to shrink even as the major indexes trade at new all-time highs. Last week’s number of Weekly Highs was well below their peak reached in mid-March at 951. A reversal in this trend of dwindling New Highs would suggest the market is poised to make a more sizable move higher. New Weekly Lows are also remaining stubbornly elevated which also hints at continued sideways trading with a minor bias to the upside.
Even with inflation metrics coming in at multi-year highs, the spread between the 90-day Treasury rate and the 30-year Treasury rate continues to narrow (8). A flattening yield curve is generally not good for banks but falling longer-term rates do typically provide a boost to corporations and consumers. Corporations can continue to finance stock buybacks and dividend increases while consumers could see lower rates for mortgages and other major purchases (if the banks are willing to lend).
Click for larger graphic…