Aloha friends. We’ve seen a lot these past two weeks in Hawaii from snorkeling with sea turtles and swimming in waterfalls on Maui to the southernmost point in the U.S. and Kilauea Caldera on the Big Island, then to surfing Hanalei Bay and hiking the Na Pali Coast in Kauai and now Waikiki Beach on Oahu for the last leg of the trip. We will be heading to Pearl Harbor National Memorial and Banzai Pipeline before heading home. We joke each time we jump to a new island that this is our favorite island so far.
Economically the islands are booming again despite the governor’s recent call for tourists not to visit the islands right now and restaurants at 50% capacity. Rental cars are rather scarce and super-high priced. The Islands are bustling, though you can still see the economy being held back by the pandemic fears and protocols, but the Aloha Spirit prevails.
As the summer travel season winds down here in Hawaii as well as on the Mainland and the rest of the world the market faces seasonal challenges as the third quarter comes to a close in the September, which is still the worst month of the year. The market is also struggling technically on the charts and has been exhibiting weak market internals.
Some geopolitical hotspots have flared up, namely our old nemesis Afghanistan, as well as persistent troubles in the Middle East, the Far East and with Russia. Add in fears of the Delta variant fourth wave of Covid-19 and Fed taper chatter and the potential for a late-August/September selloff increases or at least pause in the march to continued new highs. But until the fiscal spending spigot flow rate is reduced and the Fed telegraphs it will begin to tighten the market is likely to wander higher on stimulus and easy money.
As you can see in the updated chart here of the S&P 500 One-Year Seasonal Pattern Since 1949, the market has so far defied the typical seasonal summer weakness it normally exhibits. The market continues to rally on pent up demand from pandemic restrictions as well as trillions in federal fiscal stimulus and continued quantitative easing and still historically low interest rates from the Federal Reserve.
If the market continues to defy gravity and rallies through Labor Day, the next most likely weak spot is the end of September after Triple Witching on the third Friday of September as noted by the two purple arrows in the chart. We are not expecting any major sell off here. At most we’d expect a 5% correction or so as the market succumbs to some of the same headwinds we have been experiencing all year.
Sentiment remains elevated though bullish advisors have diminished some with a few more bears and the weekly put/call ratio in the Pulse has up ticked. Valuations remain elevated as earnings growth has likely peaked and the easy comps to last year’s pandemic lows fade away. Market breadth is not too fresh with a dearth of new highs and expanding new lows as the indices have logged new highs. Weekly advancing stocks versus declining stocks have been mixed as well.
We continue to expect the market to wander higher with the potential for a pause or sell off highest toward the end of September. Any late-September/October sell off would set up out next Best Months Seasonal MACD Buy Signal quite well and we still expect the S&P 500 to finish the year in the 4500-4600 range or even higher.
Pulse of the Market
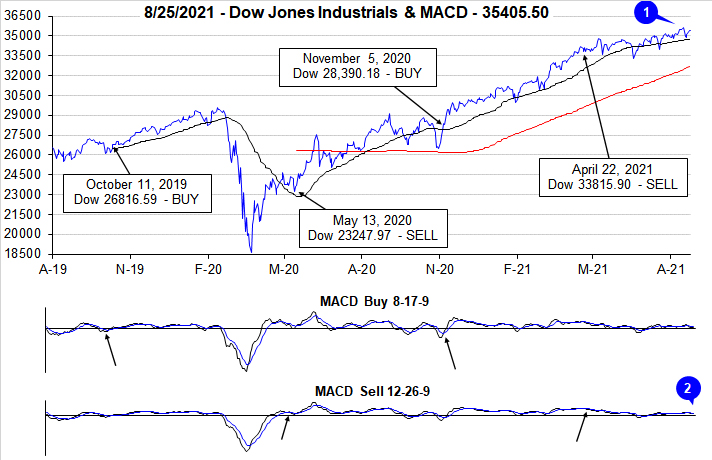
With the support of easy monetary policy, Federal spending, and solid corporate earnings, DJIA has avoided typical seasonal weakness this August climbing to multiple new all-time closing highs and a gain of 1.3% as of its close on August 25. However, the new closing highs were all around mid-month (1) which has historically been the strongest part of the month. Prior to and after mid-month, DJIA has been meandering unable to sustain the run higher or make a clear move meaningfully lower. As a result both the faster and slower moving MACD indicators applied to DJIA are currently negative (2).
Late July and early August weakness did trigger DJIA’s third Down Friday/Down Monday (DF/DM) warning of the year (3). Similar to the mid-July occurrence, DJIA did quickly recover its modest losses which have historically been followed by a lower chance of any additional weakness in the near-term. DJIA’s current streak of 16 of the last 20 Friday’s being positive shows traders and investors must be growing increasingly comfortable with the economy and the market.
For the most part S&P 500 performance (4) has mirrored DJIA. Since the final week of June both DJIA and S&P 500 have advanced six out of nine weeks. NASDAQ (5) has one additional weekly loss over the same time period. All three indexes moving in the same direction at the same time suggests the impacts of Covid-19 are falling as all corners of the economy return or at least appear to be heading ever closer to pre-pandemic levels.
Market breadth measured by NYSE Weekly Advancers and NYSE Weekly Decliners (6) has been mixed over the past four weeks and remains an area that warrants attention. Typically Weekly Advancers will outnumber Weekly Decliners in positive weeks and vice a versa during down weeks. The greater the advantage one has over the other generally correlates with the magnitude of the move. This has not always been the situation in recent weeks.
The trend of Weekly New Highs (7) is also worrisome as they continue to shrink even as the major indexes traded at new all-time highs recently. Last week’s number of Weekly Highs was well below their peak reached in mid-March at 951. New Weekly Lows are now troublingly expanding. Last week’s count of 248 was the highest since late March when they hit 262. To find a greater number of New Weekly Lows you have to go back to the beginning of the pandemic in March and April of last year.
Interest rates have been relatively stable over the past seven weeks with the 30-year Treasury yield (8) oscillating around 1.90%. This could change soon as many are expecting Fed officials to signal their approach to tapering asset purchases this week during its annual Jackson Hole symposium (now virtually) on Friday, August 27.