Well. Seasonality is back. Everyone in the financial media has been talking about September seasonal weakness lately. And here we are in September and the market has sold off the 5% or so we projected last month. And it did so in the notoriously treacherous week after September quarterly options and futures expiration.
Then as expected traders and fund managers bought the 5% dip as they have throughout this bull market rally with the blessing of the Federal Reserve’s continuing dovish tone and accommodative policy that they reinforced at the conclusion of yesterday’s FOMC meeting.
We do not expect stocks to succumb to the October curse this year. That doesn’t rule out some downside disturbance, but we do not foresee an impending crash, massacre or big selloff of the sort that have given October it’s dubious reputation as the jinx month. Many of the same geopolitical, political, fundamental and technical headwinds we highlighted last month remain, as well as some others, so another 5% or so pullback is quite likely as Wall Street still may suffer from chronic “Octoberphobia.”
We’ve been doing this for decades and this pullback was prototypical end of Q3 window dressing and institutional selling. Several factors weighed on the markets, but most had been there all year. So why did the market selling off this month? Seasonality.
As you can see in the chart here of the updated S&P 500 One-Year Seasonal Pattern Since 1949, over the last 72 years and the more recent 33 years, late September weakness is apparent (noted by purple arrows) along with the October turn and strong year-end rally that runs through the Best Six Months that end in April.
Last year we had a November for the record books with a rally that continued beyond yearend into late April/early May as you can see here in the green line. Then we suffered some usual May/June weakness, followed by a customary mid-year rally with the usual first half of July strength. August was unseasonably strong except for the 2% correction mid-month and now September has delivered its vaunted selloff.
We’ve seen this September weakness before and expect this turnaround to continue with a strong potential for retest of the recent lows in October as is often the case with either a slightly higher or lower low – a higher low would clearly be more constructive.
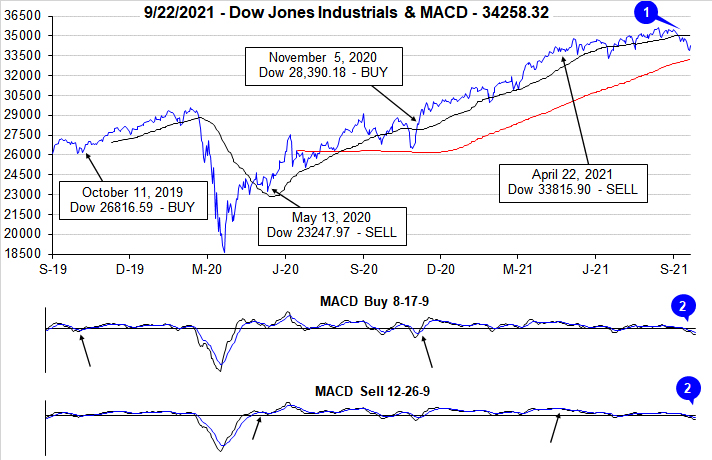
So we stick with the system which is designed to avoid and capitalize on seasonal September weakness and jump on the October turn with our MACD Best Six Months Seasonal Buy Signal. The upcoming Best Six Month promises to deliver like it did last year and year in and year out.
Nothing is perfect or works all the time and we’ve seen some bad Best Six Months over the years, but they have been few and far between (see page 54 of the 2021 Almanac). The Best Months with MACD timing has trounced the Worst Months with a gain of 8.9% for DJIA vs. -0.4% (updated numbers from the 2022 Almanac out next month). Even over the past 12 years since the March 2009 bottom the Best Six Months have doubled the performance of the Worst Months.
There are several issues that could trigger an October slide. The Chinese Evergrande crisis seemed more like an excuse for the recent selloff and we suspect that the Chinese government will coordinate and control a solution there and curtail any fallout. There’s the debt ceiling issue. We been here before and Congress will likely wait until the 11th hour, but they will raise it and not put the full faith and credit of the U.S. government at risk.
The tax increase many fear is looking less and less likely to pass as the proposal is being met with resistance from many camps and President Biden’s approval ratings have slipped. Inflationary pressures are proving to be somewhat transitory. Yes inflation will be increasing as it usually does, but rampant inflation does not appear to be a concern.
Any increased chatter about the Fed raising rates sooner than later in 2022 is likely the biggest risk to stock prices. Since the market has a history of October turnarounds, whatever it is that may trigger another bout of weakness in October, please don’t react and get flushed out of the market. Instead be ready to act on our next Best Six/Eight Months MACD Seasonal Buy Signal that can occur any time on or after October 1.
Pulse of the Market
After a tepid finish to August, DJIA’s struggles only grew in September. Seasonally, this is not a surprise as September has been the worst month of the year for DJIA since 1950. DJIA closed below its 50-day moving average (1) on September 9 and has remained below it since then. The current streak of closes below DJIA’s 50-day moving average is the longest streak since the pandemic erupted and the market sunk last year in March. Both the faster and slower moving MACD indicators (2) applied to DJIA have been negative and trending lower since mid-August confirming the loss of positive momentum and the change in direction by DJIA.
In addition to negative MACD indicator signals, DJIA logged its fourth Down Friday/Down Monday (DF/DM) warning of the year on the first Friday and Monday of September. This DF/DM was promptly followed by a 2.15% weekly DJIA loss during the week ending September 10. DJIA then recorded its fifth DF/DM (3) at the start of this week. Historically a cluster of DF/DM’s like that which just occurred has frequently marked a significant inflection point for the DJIA.
Based upon past DF/DM clusters, should DJIA quickly recover the losses and return to pre-DF/DM levels, then the worst of the pullback is likely over. However, should the current rally come up short then additional weakness could quickly materialize. DJIA 35,450 and above in the near-term would be positive while any level less than this would be worrisome.
DJIA’s recent weakness has also been accompanied by S&P 500 (4) and NASDAQ (5) weakness. Broad, across-the-board weakness is likely partly due to seasonality and partly due to Fed uncertainty ahead of this month’s regularly scheduled meeting. Based upon the last two trading days, the market does appear to be pleased with how the Fed is handling policy now, but that sentiment could change.
Market breadth measured by NYSE Weekly Advancers and NYSE Weekly Decliners (6) has been reasonably aligned with weekly performance over the last four weeks. In advancing weeks, Weekly Advancers have outnumbered Weekly Decliners while the opposite has been largely true in down weeks. As observed last month, any divergences from this could be an early indication of market weakness.
During the first two weeks of September trading, Weekly New Highs (7) were trending positive. That was not the case the past two weeks. Weekly New Lows appear to have peaked in August at 248 during the week ending on the 20th and have been declining or trying to decline since. This mixed trend in New Highs and Lows does appear consistent with a market that is only a handful of percentage points from all-time highs.
Interest rates have been relatively stable over the past eleven weeks with the 30-year Treasury yield (8) oscillating right around 1.90%. This would seem to signal that the long-dated end of the Treasury yield curve is more connected to long-term growth and inflation trends rather than what the Fed is doing now or may be doing sometime in the near future.