As we laid out in our
2021 Forecast Best Case scenario last year Covid-19 vaccines rolled out rather well in 2021 allowing lockdowns and most restrictions to be removed. Additional fiscal stimulus and an extremely accommodative Fed kept the economy humming and the market rallying. As illustrated in the chart of our Four Horsemen of the Economy below unemployment dove from the early pandemic peak rather precipitously. Leisure, hospitality and travel did not surge per se, but they sure did rebound.
With 10 trading days left in the year the market is on pace to deliver somewhere in the range of our Base and Best Case scenarios for 2021 with DJIA up 17.3% year-to-date at today’s close, S&P 500 up 24.3% and NASDAQ up 17.8%. That’s Best case for DJIA and S&P and Base Case for NASDAQ.
Omicron, inflation and the Fed’s tapering of its accommodative asset purchase program have been giving the market jitters the past few months and creating some volatility. Yesterday the Fed came clean on inflation being more persistent, but they also remained rather dovish, reiterating their measured pace of tapering asset purchases and patience with raising rates. This flexibility and reassurance that they are keen on curtailing rampant inflation while remaining supportive of the tentative economic outlook in the face of the enduring pandemic was bullish for Wall Street.
We are still bullish for yearend and anticipate the results of the Santa Claus Rally to help solidify our outlook for next year. The Santa Claus Rally has been in the news quite a lot lately as everyone is looking for an excuse to remain bullish. But what everyone is really referring to is the usual last half of December rally.
The Santa Claus Rally was defined by Yale Hirsch in 1972 as the last five trading days of the year and the first two trading days of the New Year. S&P 500 averages 1.3% over the 7-day period, but the real importance of the SCR is as our first seasonal indicator of the year ahead. As the late, great Yale Hirsch’s famous line states, “If Santa Claus should fail to call, bears may come to Broad and Wall.” Perhaps we should rename it “The Santa Claus Indicator?”
Our outlook for next year is less than sanguine. The market faces several obstacles for next year. Valuations are rich and year-over-year economic and corporate comparisons will be nowhere near as easy as this year versus the 2020 pandemic numbers. While the Fed has promised patience and a slow pace it is now rather clear that they will be making a concerted effort to remove quantitative easing by mid-year and begin slowly raising rates.
This punchbowl of free money sloshing around and the past decade or ZIRP (zero interest rate policy) has been feeding the bull and allowing valuations to get historically high. When the Fed Kool-Aid is gone the party is likely to quiet down. We are not expecting anything sinister or a deep nasty bear market, but a reversion to the mean and a decent correction cannot be ruled out.
Market internals and technicals are also concerning as we have failed to break out to new highs since the beginning of November – S&P did make a marginal new high, but it has not held yet. As the old Blood, Sweat & Tears classic track “Spinning Wheel” taught us: “What goes up must come down.”
There are also some geopolitical concerns as Russia masses troops on the Ukrainian border, basically challenging NATO and the U.S. In the recent video summit Putin and Xi Jinping exuded solidarity and planned a meet and greet at the Olympics. Meanwhile China continues to stiff-arm the U.S. on many fronts as the West snub China on the Olympics. Iran and North Korea continue building their nuclear capacity and foment hostility.
But imminent pressure on the market is most likely to come from Washington as is often the case in the battleground that is the midterm election year. President Biden’s approval rating has plummeted since the botched withdrawal from Afghanistan and many are not pleased with how he is handling international affairs and are opposed to Covid mandates. All this has hardened Republican opposition and is likely to boost their resolve and support in the midterm elections. And that is what makes midterm years a bottom picker’s paradise.
Midterm election years are usually a volatile year for stocks as Republicans and Democrats vie for control for Congress, especially under new presidents. Incumbent presidents usually lose seats in the House of Representatives (see 2022 STA page 28) and with the razor thin margins Dems have in both the House and Senate they could easily give up control of Congress in the midterms.
The chart here of the “S&P 500 Midterm Election Year Seasonal Pattern Since 1946” does not paint a rosy picture for 2022. Along with the pattern for all years and all midterm years since WWII we have overlaid the patterns for 1st term midterm years, Democratic president midterm years as well as the 2nd year of new Democratic presidents.
All midterm years average an S&P 500 gain of about 6%, Democratic president midterm years average about 4%, but 1st term midterm years average a loss of -0.6% and the 2nd year of new democratic presidents have been down -2.3% on average. All four tend to hit an early year high in April at the end of the Best Six Months with a low point during the Worst Six Months May-October.
Four Horseman of the Economy
Up until recently our lead horsemen DJIA along with S&P 500 and NASDAQ have been steadily making new highs, but we are seeing a few chinks in the armor as DJIA may be beginning to flatten out in the Four Horsemen Chart below. The major averages are likely to notch more new highs before they submit to the usual midterm year correction as market internals indicate some broader market weakness.
Consumer spending and retail sales have been hot for the past year, but have pulled back recently as inflation continues to rise. Consumer confidence is concerning as it failed to break above 100 and has been falling steadily since April. If Covid shifts to a more endemic phase like the flu managed with vaccines and therapies as many experts have been indicating and the economy and life continues to return to normal – and inflation cools down by mid-2022 as we expect – then confidence will return to the consumer.
On the good news front the Unemployment Rate continues to decline and remains at a healthy low level of 4.2% seasonally adjusted (3.9% not seasonally adjusted). The “Help Wanted” signs are everywhere and most anyone who wants a job can find one. Wages also continue to rise so when the holdouts from the pandemic come back to work they should be well paid. Initial jobless claims up-ticked recently off the post-pandemic low, but this does not concern us as the level remains low and the trend is lower.
Finally, our inflation horseman as measured by our 6-month exponential moving average calculations on the CPI and PPI have risen sharply since summer 2020, which should not come as a major shock considering the massive government spending and quantitative easing we’ve had over the past 18 months or so. CPI is at the highest levels since 1991 and PPI, fueled higher by supply chain disruptions, is at levels not seen since the peak of the stagflation days in early 1975. As Covid turns endemic and manageable and supply chains bottlenecks are loosened, the Fed should be able to quell inflation sometime in the middle of next year.
Pulse of the Market
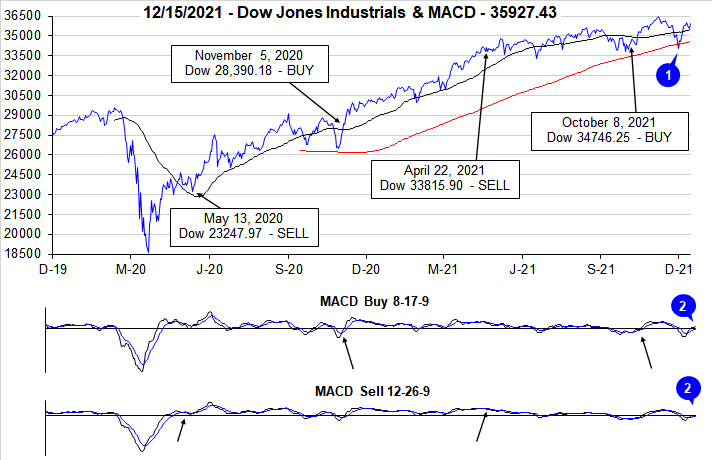
Omicron and a pivot by the Fed towards a more hawkish policy stance spoiled this year’s typical late-November/early December market rally. DJIA began its retreat during the post-Thanksgiving, shortened trading day by tumbling over 900 points. Selling then accelerated the following week as Fed Chairman Powell gave testimony to members of Congress. At the trough of DJIA’s selloff it had plunged below its 50- and 200-day moving averages (1). This initial reaction to omicron and the Fed ultimately proved excessive and DJIA quickly rebounded to reclaim both moving averages and our key level of 35600. DJIA’s recent surge off its early-December lows has turned its faster and slower moving MACD indicators (2) bullishly positive. This could be an early indication that the typical yearend rally is resuming.
DJIA’s November weekly losing streak extended into December but came to an end on the third day at four weeks (3). Rather bullishly, DJIA’s losing streak did not have a Down Friday/Down Monday (DF/DM) occurrence. Historically DF/DM’s have preceded further losses over the next 90 calendar days. Although this does not completely rule out the possibility of additional weakness in the near-term, it does improve the odds that December finishes reasonably well. S&P 500 (4) and NASDAQ (5) fared better over the last five weeks with only three weekly declines.
As one may suspect, NYSE Weekly Advancers and Weekly Decliners (6) were consistent with the market’s overall moves. Decliners outnumbered Advancers during losing weeks while the opposite occurred in advancing weeks. Caution flags generally get raised when this relationship does not appear.
Weekly New Highs (7) continued to contract into December but may have turned the corner last week as New Lows hit their highest level since the start of the global pandemic last year in March. If the market does resume its pre-omicron rally look for confirmation from an expanding number of New Weekly Highs and shrinking New Weekly Lows. Last-minute tax-loss selling could inflate New Weekly Lows in the near-term which is fine as long as Highs are also increasing.
Despite inflation running at multi-decade highs and a Fed pivoting towards a hawkish policy stance, the 30-year Treasury yield (8) is still under 2%. It would seem that bond traders are the last group to insist that current inflation is not likely to last significantly longer or go higher. No matter the reason why, rates are still low when compared to historical levels. Low rates have generally been a positive for stocks, and as long as they remain subdued the market will likely manage to work its way through recent volatile trading.
2022 Forecast
Base Case: 65% Probability – Current trends remain reasonably intact through the end of 2022. Fed ends QE and starts slowly raising rates. Covid persists, but vaccines and therapeutics slowly push its impact toward manageable/managed. Expect an early year high, followed by a Worst Six Months correction and a Q4 rally. S&P 500 likely finishes 2022 up 5-10%. DJIA similar, NASDAQ modestly weaker.
Best Case: 25% Probability – Current trends see further substantial improvement throughout the year. Covid is managed; supply chains run smoothly pulling down inflation and Fed drifts towards a neutral bias. S&P 500 likely finishes 2022 up 10-17%. DJIA similar, NASDAQ modestly weaker.
Worst Case: 10% Probability – Current trends see significant deterioration, omicron and/or new variants delay managing Covid. Inflation does not moderate instead stagflation sets in. Mild bear market for S&P 500 with 2022 ending down 10-20%. DJIA similar, NASDAQ not as bad yet still negative.
We will be keeping you fully abreast of all readings from our three January Trifecta Indicators: Santa Claus Rally, First Five Days and the full-month January Barometer and will make adjustments on the close of January 2022. So unless the market crumbles quickly in the near term be prepared for gains to be harder to come by in 2022 and be ready to pounce on the usual midterm bottom. Longer term our May 2010 Super Boom Forecast when the Dow was around 10,000 for the Dow to reach 38,820 by the year 2025 may still be ahead of schedule. (Check out the update of the Super Boom Forecast in the April 11, 2019 subscriber alert on our website.)
Happy Holidays & Happy New Year, we wish you all a healthy and prosperous 2022!