In our 2022 Annual Forecast last month we were candid about our less than sanguine outlook for 2022 and that we were expecting a reversion to the mean in annual returns and a decent correction. We shared the many obstacles and hurdles we felt the market would be facing in 2022. First and foremost are the forces of the 4-Year Cycle and the impact the midterm elections have on the market.
Midterm election years are notoriously volatile as the two political parties battle it out with the opposing party hammering the incumbent president publically, politically and legislatively to control Congress. And this is particularly pronounced for first term presidents like Joe Biden. We have added 2022 year-to-date performance to our chart here of the “S&P 500 Midterm Election Year Seasonal Pattern” and it’s not pretty.
The market has already exceeded the average midterm low this year. But we might find some solace from the table on page 34 in the 2022 Almanac on “Why A 50% Gain in the Dow Is Possible from Its 2022 Low to Its 2023 High.” In the table on that page you will note that of the 27 midterm lows since 1914 the month with the most midterm year lows is January with six. That’s not to say we believe the low for the year is in as the midterm low as you can see in the chart usually comes during the weak spot of the 4-Year Cycle during Q2 or Q3.
Selling Climax Finding Support
The current volatile selloff is disconcerting for the market with several technical support levels already having been breached and support near the October 2021 low around the S&P 500 4300-level currently under attack. Interestingly though, the old stodgy DJIA has been holding up best finding some support for now around 34000. DJIA has not closed below its December closing low of 34022.04 reached on December 1, which means the “December Low Indicator” (2022 Almanac page 36) has not been triggered.
Technical damage has been done, with the major averages breaking through the old uptrend line from the October 2020 low, falling below their 200-day moving averages and now finding resistance at those 200-DMA levels. But we may have seen an Advance/Decline Ratio Selling Climax when more than 70% of total issues traded declined on January 18 and 21 with less than 20% advancing. If the market can find some support here at least in the short-term we could see the market rally into the end of the Best Six Months in April.
But the market still faces obstacles beyond the adverse midterm year forces and the technical breakdown. Geopolitically, pressures have not abated as the situation with Russia and Ukraine remains fluid and the diplomatic dance with China on Taiwan and other fronts continues as well as the usual hot button issues in the Mideast and with North Korea. Rich valuations have come down a bit but they are still elevated. Corporations will have difficulty beating last year’s results with 2021 year-over-year comparisons being a hard act to follow in 2022. Then there is inflation and the Fed shifting from its longtime extremely accommodative stance to a neutral/tightening bias.
And of course there are the discouraging results from our January Indicator Trifecta. The Trifecta started the year on a positive note with the Santa Claus Rally (SCR) coming in with a gain on the second trading day of the year. But that was quickly squashed as the S&P 500
declined for the First Five Days (FFD) of January. And with only two trading days left in January it is highly unlikely our January Barometer (JB) will be positive. S&P 500 would need to rally 10.2% or 439.68 points to overtake the 2021 close of 4766.18 – a tall order indeed. Years when SCR was up but the FFD and the JB were down were not bullish. Only one of the eight occurrences (2014) saw full year gains. A Down January is not a positive indication for the year (
2022 Almanac page 22).
But there are some positives. The economy is booming with the full-year 2021 GDP number the best reading in three decades since we came out of the double dip recession in 1984. And while the market is suffering from Fed phobia we expect the Fed to be in no rush to quell inflation with a major tightening cycle. They have not been in any hurry up to now so why would they suddenly speed up. They will most likely remain data dependent and maintain their wait-and-see attitude. We expect 4 rate hikes this year and for them to occur at the FOMC meetings associated with their Summary of Economic Projections in March, June, September and December. But most importantly, even after the anticipated increases, rates will remain historically low.
All in all we expect the market to find support here in February and then rally back toward the recent highs by the end of the Best Six Months in April. After that we expect a retest of the current lows and perhaps lower lows in the Worst Six Months of 2022, the weak spot of the 4-Year Cycle, followed by a Q4 rally at the beginning of the sweet spot of the 4-Year Cycle in line with our
2022 Annual Forecast Base Case Scenario with S&P 500 and DJIA finishing 2022 up 5-10% and NASDAQ slightly weaker.
Pulse of the Market
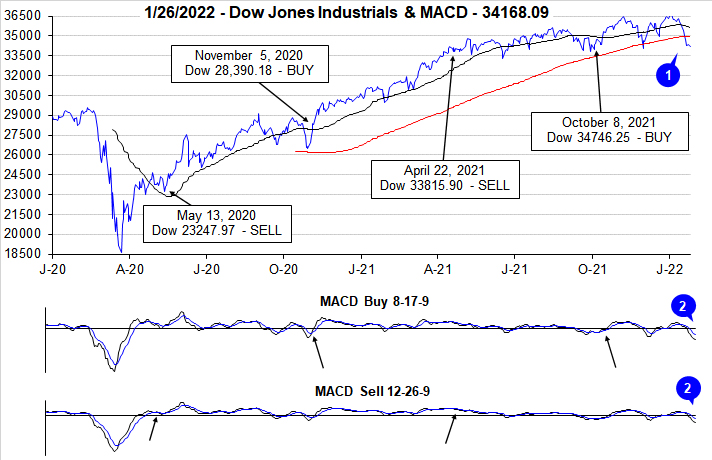
For the second time in as many months, DJIA has fallen below its 200-day moving average (1). DJIA’s last excursion in early December lasted just one day while it’s currently been six days, including today. Now that this key support level has failed, it is increasingly likely to be ever more challenging to reclaim the 200-day moving average level. At yesterday’s close DJIA was down 6.0% and on course for its eighth worst January since 1901 based upon percent. DJIA’s brisk retreat is confirmed by negative readings from both the faster and slower MACD indicators (2).
DJIA (3), S&P 500 (4), and NASDAQ (5) have all declined for three weeks in a row and since the second week of November DJIA and NASDAQ have only advanced in three weeks of eleven weeks. S&P 500 has a slightly better record with four weekly gains over the same time period. During this market retreat, DJIA has logged three Down Friday/Down Monday (DF/DM) occurrences with two landing in January. Historically, DF/DM occurrences have frequently been a warning as numerous occurrences were followed by further declines sometime during the next 90 calendar days.
NYSE Weekly Advancers and Weekly Decliners (6) have been consistent with the market’s move. Decliners have outnumbered Advancers during losing weeks while the opposite occurred in advancing weeks. Last week’s 3262 NYSE Weekly Decliners suggests there is broad participation in the current market correction. A week of solid gains accompanied by a solid number of Weekly Advancers that exceed Weekly Decliners could be an early indication that the market is on the verge of or has changed its course. Baes upon historical seasonal pattern for Midterm years, this may happen anytime between now and around mid-February. But, for this to transpire, the market first needs to accept the fact that the Fed is ending QE and will be raising rates.
With major indexes falling every week this year, Weekly New Highs (7) continued to contract after a brief reprieve during the last week of 2021. New Lows have ballooned to their highest level since the start of the pandemic in March of 2020. When major indexes find support and begin to turn the corner, the number of New Lows should be the first to turn.
Even after another inflation reading came in at a multi-decade high and the Fed essentially laid out its path to rising rates, the 30-year Treasury yield (8) has only risen to just above 2%. Although higher than any reading in the last 20 weeks, the 30-year Treasury yield still has not exceeded its own high yield from last March. Yields across the curve have been on the increase, but compared to historical levels all remain low.