Inflation, war, recession fears, aggressive Fed rate hikes, lingering supply chain issues, layoffs, earnings misses, and lingering pandemic issues drove the market into official bear market territory last month. Driven by hopes of a soft landing, a resilient labor market, pockets of positive economic and corporate results, and some rather seriously oversold conditions in big name tech and growth stocks the market has rallied smartly off the June lows.
As of today’s close, DJIA is up 8.8% from the June lows, S&P is up 11.1% and NASDAQ is up 14.2%. The 2022 summer rally has worked the bulls into a frenzy like a matador with his red muleta, pushing the Dow toward a top-ten July, up 5.7% at todays close with only one trading day left in the month, qualifying this as a “Hot July Market.”
Gains of this magnitude for July, however, have frequently been followed by late-summer or autumn selloffs and better buying opportunities than now. In the past, full-month July gains in excess of 3.5% for DJIA have been followed historically by declines of 7.2% on average in the Dow with a low at some point in the last 5 months of the year.
2022 Tracing Justin Mamis’ Sentiment Cycle
Here is a little sneak peek into the 2023 Stock Trader’s Almanac as we send it off to press that is also remarkably apropos now. The 2022 edition features “Marty Zweig’s Investing Rules” on page 80. For the 2023 edition on this page, we are featuring “Bob Farrell’s Market Rules to Remember & Justin Mamis’ Sentiment Cycle.”
90-year-old Bob Farrell has retired to Florida, but he still imparts his forecasts and outlook to investors and traders from time to time. We will touch on his “Rules to Remember” at another time.
Justin Mamis passed away in 2019, but his books and wisdom are still relied upon regularly to this day. Mamis was a highly regarded market analyst and technician who authored three must-have books on the stock market: When to Sell (1977), How to Buy (1982), and The Nature of Risk (1991) and two must read newsletters.
Just before we presented at the CMT Association’s 2022 Annual Symposium veteran technical analyst Helene Meisler shared Mamis’ Sentiment Cycle (pictured below) along with her analysis of where in the cycle the market was at the time at the end of April 2022—in that brief pause between disbelief and panic (green circle).
Comparing the current chart of the S&P 500 below we’ve highlighted in yellow that area of disbelief Ms. Meisler pointed out in April. Our assessment is that the June low correlates quite well with the “Panic” point on Mamis’ chart and we are now hitting the first level of “Anxiety.” This dovetails with our bearish seasonal/cycle outlook as we are entering the worst two months of the year and are smack dab in the
“Weak Spot” of the 4-Year Cycle from Q2 to Q3 of the midterm election year.
Our view on the economy is less than sanguine as we just logged the second quarter in a row of negative GDP with rampant inflation only just beginning to take its toll on Main Street. Cheerleading aside, we have not definitively averted recession. It may yet prove to be mild, but the effects of the Fed’s aggressive rate increase have yet to really hit home, and another hike is likely in September.
While the summer rally off the June lows has been impressive, the market is now running into technical resistance around the early June highs. Sentiment has rebounded with the market but is by no means bullish. Market internals have been choppy with New Lows still outpacing New Highs and without any material rise in the Advance/Decline Line.
We believe the bear market is nearing the end, but this July bounce is a classic bear market rally before the final push lower. Remember, July is the best month of Q3. But “Hot July Markets” like this year are often followed by lower prices and better buying opportunities later in the year.
August and September are the worst months of the year, and we are facing some rather stiff headwinds with respect to the war in Ukraine, inflation, rate hikes, growth and the midterm elections. But the
“Sweet Spot” of the 4-Year Cycle from Q4 midterm year through Q2 pre-election year is only two months away. Cash is still king. Stick to the playbooks and look for a retest of the lows in the August-October period, which we expect to deliver the next fat pitch for the “Sweet Spot” and the return of the bull.
Pulse of the Market
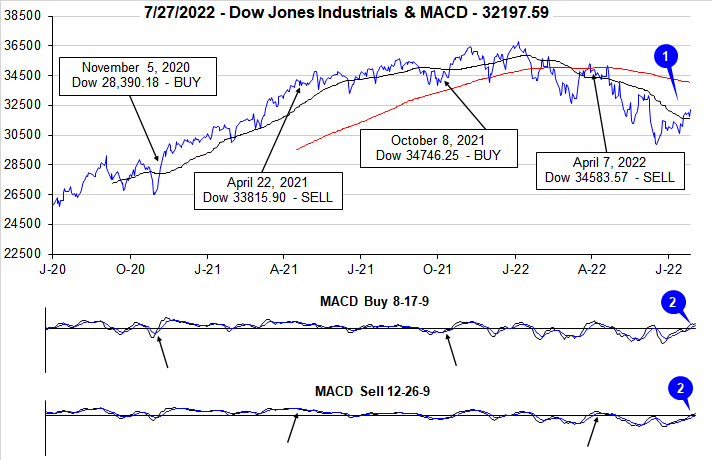
After an abysmal first half of the year, DJIA has managed to extend its rally off the June lows into July (1). As of the close today, July 28, DJIA was up 5.7% in July which is strong enough to claim the 10th best July performance by percent going back to 1950. Based upon points gained, it would be DJIA’s best July ever. July’s gains have pushed DJIA back above its 50-day moving average, but still 4.4% below its 200-day moving average. The rebound has also persisted long enough to push both the faster and slower moving MACD indicators back above the zero line (2). As MACD climbs higher above the zero-line, overbought indications tend to strengthen.
Should this week’s gains hold, DJIA (3), S&P 500 (4) and NASDAQ (5) will log their first back-to-back weekly gains since late March. It would also be the first time since last October when all three indexes were positive in at least four of six weeks. With the historically worst two months of the year, August and September, just ahead, the current streak of gains could quickly come to an end.
NYSE Weekly Advancers and Weekly Decliners (6) have been consistent with the market’s overall choppy moves higher off of the June lows. During down weeks the number of Weekly Decliners expanded and during positive weeks Weekly Advancers held the advantage. A significant spike in the ratio of Weekly Advancers to Weekly Decliners is still absent from the table. Without a spike similar to past major bottoms, the odds of a retest of the June lows remain elevated.
Despite the recent rebound, New Weekly New Highs (7) have remained disappointingly low at just 54 during the week ending July 22. Even during the first two weeks of June when the market was in near free-fall there were a greater number of new highs. Somewhat encouraging, New Weekly Lows have retreated to their second lowest reading of the year. There were fewer at the start of June. A trend of increasing new Highs and shrinking new Lows would be a positive sign.
Even before Q2 U.S. GDP was released the spread between the 90-day Treasury and the 30-year Treasury had been narrowing (8). The 90-day rate was climbing in anticipation of the Fed raising rates again while the 30-year was declining on growing recession fears. Since the start of the year the 90-day rate has gone from essentially zero to approximately 2.5% while the 30-year rate has climbed about one full point. The percentage of the yield curve that is inverted continues to expand which has historically been another recession indication.