We coined the term “bear-killer” for October way back in 1968 in the 1969 Stock Trader’s Almanac, the second edition. The original theory from the 1969 Almanac still holds water.
October has been the big bargain month of the post-World War II era. Its chief asset is its enviable position in the calendar. It falls in front of the most bullish three-month span of the year (November, December and January). At this time, volume picks up considerably and there is a great seasonal demand for stocks.
Driven by the annual surge of investment funds into the market, October has been a turnaround month—a “bear killer” if you will, turning the tide in twelve post-WWII bear markets: 1946, 1957, 1960, 1962, 1966, 1974, 1987, 1990, 1998, 2001, 2002 and 2011 (S&P 500 declined 19.4%). Seven of these were midterm years. In addition, so many stalled bull markets seem to get moving again during this month.
Amazing how little this has changed in 54 years despite the many systemic changes to the market, technological advances and shifts in collective human behavior and behavioral finance. The negative seasonality in September and volatility in October that creates “Octoberphobia” and turned October into a “bear-killer” comes from fund tax selling, end of Q3 window dressing and portfolio restructuring.
Down YTD Q3
S&P 500 is down -23.9% year-to-date at the close of the market today. With one day left in September S&P 500 is on the brink of the 4th worst YTD Q3 performance since 1930. In the table here we show the record of the previous 23 years since WWII (1946) when S&P 500 was down for the year at the end of Q3.
In all 23 years the following Q4 was up 69.6 % of the time for an average gain of 3.1%. Subsequent Q1s were up only 52.2% of the time for an average gain of 2.7%. The following Q2s gained ground 65.2% of the time for an average gain of 2.9% and then next years were up 73.9% of the time for an average gain of 11.9%.
But the record for midterm years down at the end of Q3 is better. Of those nine midterm years highlighted in blue in the table only 1946 into 1947 had no bounce with 1947 closing exactly at the same price as 1946 for S&P. Overall, Q4s were up 88.9% of the time, average gain 7.6%, Q1s up 77.8% of the time, average gain 6.7%, Q2 up 77.8% of the time, average gain 4.6% and next years up 88.9% of the time, average gain 19.2%.
So, while things look grim out there on Wall Street, economically and globally, odds are we are nearing a bottom and the prospects for Q4 and next year are encouraging, at least historically, seasonally and 4-year cycle-wise. But there is still a lot that needs to go right, and the market likely has further downside left.
We have shared several analog charts to 2022 this year, but the one that stands out to us now after taking out the June lows on DJIA and S&P 500 is the New Democratic President Midterm Year analog. The chart suggests that after a bit of a rebound in mid-October the market will make a lower low at the midterm bear market bottom toward the end of October.
While we are all anxious for this bear to run its course and for our next Best Months Seasonal MACD Buy Signal, patience and prudence is in order. As September delivered on its historic weakness October promises to present its usual volatility. Our MACD Buy Signal has come as early as October 1, though that does not appear likely this year, and as late as mid-December.
So, we stick to the plan, sit tight, adhere to the strategies and analysis that have helped us avoid most of the carnage this year and wait for the indicators to signal when we re-enter the market during the Sweet Spot and do our best to capitalize on the best time to buy stocks in the 4-year cycle.
Pulse of the Market
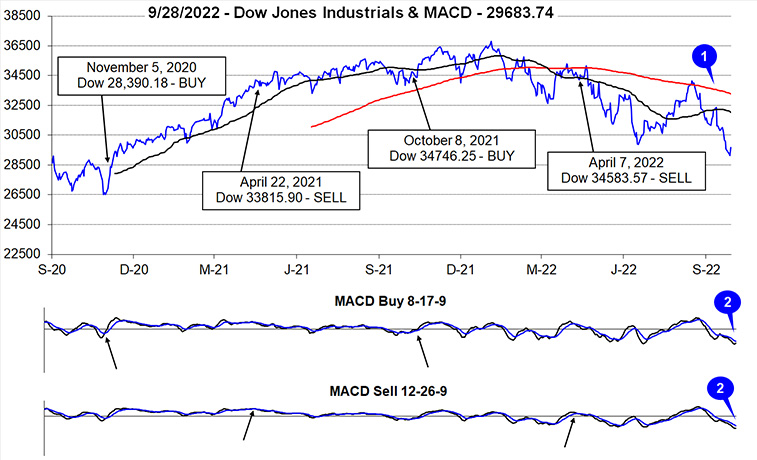
Following an above average summer rally, DJIA slipped into the usual fall slump in mid-August. From DJIA’s closing high on August 16 through yesterday’s close (September 28), it declined 13.1%. This year’s fall slump is already worse than the average going back to 1964 of –8.8%. DJIA has fallen back below its 50-day moving average (1) and closed below its June closing low. Recent weakness has kept both the faster and slower MACD indicators applied to DJIA negative and trending lower (2). Historically, the further below the zero-line MACD goes, the more reliable the subsequent signals have been. This suggests MACD is potentially setting up for a solid, seasonal signal.
This week’s trading kicked off with DJIA’s thirteenth Down Friday/Down Monday (DF/DM) of the year (3). For the most part, DF/DM occurrences this year have proceeded further declines and higher levels of volatility. Timing has varied throughout the year with little wait this time. Prior to this week’s DF/DM, DJIA registered three in a row beginning in August. Clusters like this and the high number (13) registered so far in 2022 are emblematic of bear markets (2022 Stock Trader’s Almanac page 78) while the recent one serves as a good reminder that the bear is not over with yet.
DJIA, S&P 500 (4) and NASDAQ (5) have all been down in five of the last six weeks. Barring a late day/week reversal all three are currently on track to add yet another losing week to the current streak. Like DJIA, S&P 500 has closed below its June closing low which confirms the bear market has not come to an end yet. NASDAQ (and Russell 2000) is on the cusp of closing below it June closing low.
NYSE Weekly Advancers and Weekly Decliners (6) have been consistent with the market’s overall move lower and suggest there has been relatively broad participation in the sell off with Decliners solidly outnumbering Advancers in negative weeks. Last week’s nearly 8 to 1 ratio of Weekly Decliners to Weekly Advancers was only slightly less than what occurred during the week ending June 17. Unlike back in June, the market has not responded with a bullish jump higher this week.
Weekly New Highs (7) have remained minuscule over the last five weeks while Weekly New Lows rapidly expanded. This is yet another confirming sign of the market’s troubles and lingering recession/Fed concerns. Even after jumping to 1241, last week New Weekly Lows remain well below levels observed at or near past significant market lows.
Treasury yields (8) continued to climber higher throughout the month. The 90-day Treasury rate has gone from essentially zero at the start of the year to 3.21%, as a result mortgage demand is falling, and signs of housing market weakness continue to accrue. Higher Treasury rates are also pushing the U.S. dollar to multi-decade highs. Historically, a stronger dollar has been a headwind to earnings for large, multi-national corporations that make up the majority of the market indexes.