Bears to the left of me. Recession fears to the right. There are a few bulls out there like us, Tom Lee, Ed Yardeni, Larry Williams and Walter Deemer to name a few, as well as the 44.4% of advisors in
Investors Intelligence US Advisors Sentiment indicator. But the airwaves, headlines, mainstream media and social media are teeming with calls from Wall Street strategists and independent traders for a continuing bear market that takes out or at least tests the October intraday lows. And of course, they are all convinced a recession of some magnitude is just around the corner.
Geopolitical concerns related to the war in Ukraine, China and the other usual suspects clearly exist. Investors fear inflation heating up again and the Fed will overtighten and break the economy and in turn the market, but it’s not the Fed’s job to break the economy. So far, the economy has digested the 450 basis-point rate increase rather well.
From our vantage point, this current selloff is rather typical seasonal behavior for February, especially the latter half of the month. In our familiar seasonal pattern chart for 2023 all the relevant trendlines show late February weakness. February is the weak link in the Best Six Months, November-April, and is the second worst month of the year. Plus, on the heels of the massive rally off the October and December lows the market sure needed a bit of a respite.
Hot economic data this year has investors and traders worried that the fed is going to go too far and push us into recession. Many fear inflation will not subside and instead reignite hitting Main Street and Wall Street hard in the pocketbook. Everything is much more expensive than it was just a year ago and interest rates are higher than they’ve been for over 15 years.
Our research suggests that we already had our recession with the two back-to-back negative quarters of growth in GDP in Q1 and Q2 of 2022. The NBER changed their recession rule back in 2020 during the depth of the pandemic to accommodate their agenda. And we’ve had a rolling recession across different sectors at different times throughout the past year.
Crypto and techs were crushed last year with massive, big tech layoffs, but the economy was able to digest that as well. Housing has been in decline since rates began to climb, but the supply of housing in this country is still well below demand.
The labor market remains robust, and the unemployment rate is historically low with 2 jobs for everyone who’s looking for one. And the economy continues to expand with GDP up 3.2% and 2.7% in the Q3 and Q4 of 2022 and the Atlanta Fed’s venerable and accurate GDPNow’s latest estimate for 2.5% GDP growth in 2023 Q1.
Yes, the yield curve is steeply inverted now and has been somewhat inverted for the better part of the past six months or so. And every recession in all of history has been preceded by an inverted yield curve. But what the bond yield inversion is telling us is that: 1. The bond market does not expect long-term growth to be much more than 2-3%. 2. Inflation is still not expected to stay around indefinitely and will return to trend, around 2%. And 3. Inversion = Fed is tight enough now.
Technically speaking, it looks like the S&P 500 has found some support here at the 50-day moving average and the uptrend line off the October low which runs through the December low, which looks like the right shoulder (RS) of an inverted head-and-shoulders bottom that formed late last year.
Our read of the market taking into consideration the five main disciplines (Seasonality, Fundamentals, Technical, Monetary and Sentiment) that drive our outlook is that we had a classic 4-Year Cycle Stock Trader’s Almanac Midterm Election Year bear market last year with a textbook October bottom and that the market is currently in a nascent cyclical bull market poised for gains of at least 15-20% this year.
After some continuing choppy trading in Q1 that we forecasted back in December, look for the rally to resume into Q2 as the fed slows down its pace of tightening, inflation succumbs and the soft landing or no landing scenarios begin to materialize. After some seasonal consolidation and sideways action in the Worst 4 Months July-October, a Q4 rally should push the market to new highs by yearend.
Remember 2023 is a pre-election year, the best year of the 4-year cycle for the market as incumbent presidents prime the pump and do everything in their power to get reelected. S&P 500 is up 16.8% in pre-election years since 1950 vs. less than 8% for all the other years. And this is the Sweet Spot of the 4-year cycle, the three-quarter span from Q4 of the midterm through Q2 of the pre-election where DJIA has gained 19.3% on average, S&P 500 20.0% and NASDAQ up an amazing 29.3% during the period.
Pulse of the Market
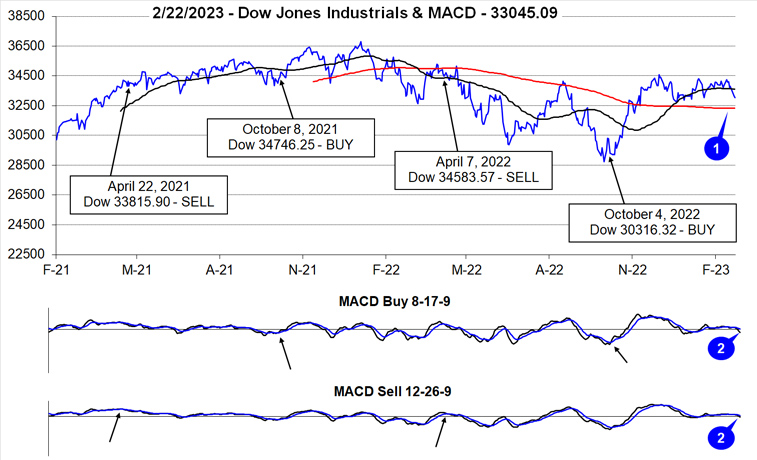
February started off in typical seasonal fashion with January’s strength spilling over. But that strength did not persist and historical second half of February weakness has kicked in. DJIA managed to remain above its 50-day moving average until this week (1) while faster and slower moving MACD indicators confirm the reversal (2). Based upon February’s recent 21-year seasonal pattern weakness could persist through the end of the month. Even the historically more bullish pre-election year February seasonal pattern exhibits second half weakness, just to a lesser degree.
As of the close on February 22, DJIA, S&P 500, NASDAQ and Russell 2000 are down in February however all remained positive year-to-date. In contrast to last year, NASDAQ is still the best performing index this year, up nearly 10%. DJIA is lagging, clinging to a fractional 0.17% gain. Russell 2000 is second best, up 7.58% and S&P 500 is mid-pack with a 3.95%. DJIA’s February struggles began early with a Down Friday/Down Monday (DF/DM) (3) during the first week. In the time since, DJIA and S&P 500 logged two losing weeks and NASDAQ one. This week is on track to add to losses.
Looking at weekly performance we find it closely follows year-to-date performance by DJIA, S&P 500 (4) and NASDAQ (5). DJIA has only advanced during three of the last seven weeks, S&P 500 has four positive weeks while NASDAQ has risen in six weeks. This choppy trading is likely to continue until the market gets a clearer outlook for interest rates from the Fed.
NYSE Weekly Advancers and Weekly Decliners (6) have remained consistent with the market’s weekly moves. Weekly Advancers have outnumbered Weekly Decliners during up weeks while the opposite was true in declining weeks. Absent unusual readings, current weakness appears to be the result of consolidation and not the beginning of a new significant down leg.
Weekly New Highs (7) also peaked in early February as Weekly New Lows bottomed. New Weekly Highs have retreated modestly since while New Weekly Lows have risen. Bullishly, the number of New Weekly Lows has remained low. As long as New Weekly Lows remain subdued, an abrupt end to the current weakness remains likely.
Recent, better than anticipated economic data has revived concerns that the Fed will need to raise interest rates even higher and potentially stay higher for longer. As a result, the 2-year Treasury bond yield (8) is currently at its highest level since August 2007. The 30-year Treasury bond yield has risen as well but remains below its highs above 4% last fall. This yield inversion is due to the Fed and does not appear to be a recessionary signal as long-term rates are rising, not falling.