While we are still bullish for the rest of 2023 overall and maintain our
best-case scenario is still in play, we are not convinced everything is fixed just yet in the near term. The recent rally off the August lows has not brought us back to the previous highs. There has been much discussion in both mainstream and social media about the seasonal weakness in August and September that we have warned you about for some time.
August has delivered on its promise of weakness, driving DJIA down -2.4%, S&P -1.8%, NASDAQ -2.2% and Russell 2000 lost 5.2% at the close of the month today. At their respective August correction lows earlier in the month all the indices were down further: DJIA -4.1%, S&P -4.8%, NASDAQ -7.4% and R2K -7.8%.
There have been some stats bandied about how a down August in the face of strong year-to-date gains is a positive sign for September. There is also the question of if an August correction has any significant effect on September weak seasonality and the infamy as the worst month of the year. So, we ran the numbers.
Of the 33 down Augusts on the S&P 500 since 1950, 17 were followed by down Septembers – just about 50/50. September averaged a loss in all 33 years of -0.65%. October was up in 20 of those years, boasting an average gain for all 33 years of 2.25%. For the last four months of the year, September-December, was positive in 26 of the 33 years for an average gain of 5.10%. Twenty-one of the 33 full years were up with an average gain of 8.31%.
Within this down August dataset are those seven years that folks are talking about where the S&P was up 15% or more year-to-date at the end of August and August was down. Yes, 6 of the 7 following Septembers were up, but 5 of the 7 following Octobers were down. One of the down Octobers followed the one down September in 1975 and the other was 2019 after August and September were net flat. Ironically, 5 of the 7 were pre-election years. So, we might have a good September, but if we do, the odds are high we’ll have a rocky October.
![[7 august ytd >15%]](/UploadedImage/AIN_0923_20230831_SP500_Down_August_YTD-gain_After_mini_table.jpg)
You really can see it on the updated seasonal pre-election year charts of S&P 500 and NASDAQ. Seasonal weakness is likely to continue through October fueled by inflation data and confusing Fed-speak, in addition to the normal perennial forces that pressure stock prices lower. The October 31 deadline for funds to reconcile accounting, Q3 institutional window dressing and retail investor fear is likely to perpetuate September-Octoberphobia. Collective repetitive seasonal behavior from market participants can fan the flames of any minor shocks.
![[NASDAQ Pre-Election Year Seasonal Chart]](/UploadedImage/AIN_0923_20230831_NASDAQ_Pre-Election_STAAC_Seasonal_Chart_900.jpg)
![[S&P Pre-Election Year Seasonal Chart]](/UploadedImage/AIN_0923_20230831_S&P500_Pre-Election_STAAC_Seasonal_Chart_900.jpg)
We do not anticipate any major selloff and expect new highs around yearend. But we do expect some sort of surprise to send stocks into another mild correction before the Q4 rally ensues. Nobody wants to talk about it or hear about it, but inflation appears to be done cooling. The big three inflation metrics, CPI, PPI and PCE all ticked higher this month. CPI and PCE are both at about 3.3%. We have argued before that 3.3% is the historical average inflation metric despite the Fed’s stated goal of 2.0%. Any further hints at higher inflation will likely heat up the “higher-for-longer” chatter and weigh on stocks.
We are also concerned that we are poised for a September surprise in the financial sector. We would not be shocked if one of the rating agencies comes out next month and announces a host of bank downgrades, perhaps starting at the top with a big bank. They did warn us back in March during the banking scare and most recently with the Fitch downgrade of the US credit rating.
Either way, we expect any weakness to be temporary and for the market to continue to track the seasonal patterns illustrated above. So, keep your powder dry until October and our Best Months Seasonal MACD Buy Signal. After any September/October weakness the most likely course of action is a yearend rally and positive 2024. Our early handicapping suggests gains of 8-12% for the main indices in 2024 fueled by the power of a sitting president running for reelection. We’ll discuss this further as we get closer to the new year.
Pulse of the Market
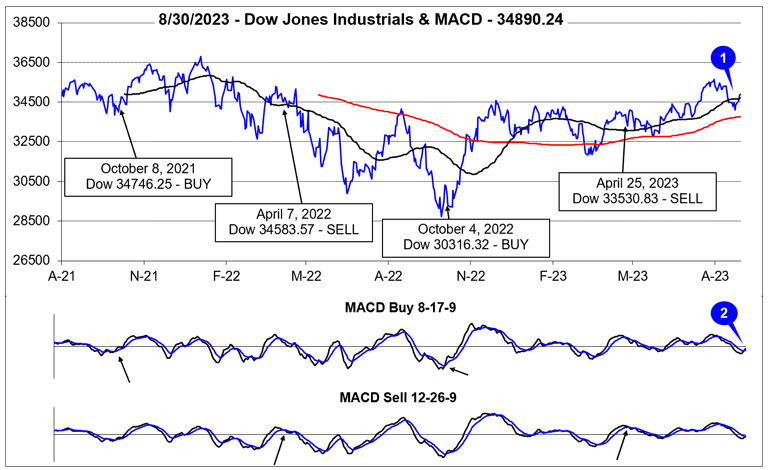
DJIA’s breakout to new recovery highs was cut short by typical seasonal weakness in August (1). DJIA retreated below its 50-day moving average just after mid-August before finding support late last week at the top of the range it had been stuck in for nearly six months. DJIA has since rebounded back above its 50-day moving average this week. The shift in momentum has been confirmed by the faster moving MACD Buy indicator (2), but not confirmed by the slower moving MACD indicator.
After advancing in three of four weeks in July, DJIA has declined in three of the last four weeks in August (3). Despite this, DJIA has not recorded a single Down Friday/Down Monday (DF/DM) occurrence since June which suggests traders and investors remain confident, perhaps more than some sentiment readings suggest. S&P 500 (4) & NASDAQ (5) were down three straight weeks to start August. The last time both were down three or more weeks in a row was in December 2022. That four-week losing streak was followed by five straight weekly gains by NASDAQ and four out of five by S&P 500. A similar outcome this time seems unlikely as seasonality does not favor the indexes now as it did back in January.
Unsurprisingly, market breadth over the last five weeks has been in line with weekly moves. NYSE Weekly Decliners swelled during down weeks and reached a peak (6) over 2500 during the week ending August 18. Historically, that level has coincided with shifts in sentiment and occurred at or near oversold levels. The market has rallied since then, but it remains to be seen if the seasonal pullback has run its full course.
Weekly New Highs and New Lows were also in line with expectations. One potential concern is New Highs sunk even further and New Lows continued to expand last week even as the indexes rebounded (7). This would appear to suggest limited participation in the rally. If this week’s numbers fail to show improvement, then the rally could be just a relief bounce.
Both the 90-day Treasury and 30-year Treasury yields continued to inch higher over the last five weeks (8). The 90-day Treasury yield is at its highest level since early January 2001 while the 30-year Treasury yield has broken above last year’s highs and is now at its highest level since May 2011. The higher rates go, the more pressure they will put on stocks. A relatively safe 5% yield looks even more attractive when stocks are just bouncing around in a range.
Click for larger graphic…