[Publication Note: The January 2024 Almanac, Vital Stats and Calendar issue will be published next week on December 28, 2023, and sent to subscribers via email after the market close. Happy Holidays and Happy New Year!]
Oxford’s 2023 Word of the Year is “Rizz” a shortened form of charisma. But “Seasonality” may be Wall Street’s 2023 Word of the Year. The seasonal patterns and 4-Year Presidential Election cycle we use as our market guideposts have been tracking quite closely for the past three years and we see no indication that will change anytime soon.
After coming into midterm 2022 cautious and turning bearish after the market did not hit our January Indicator Trifecta and Russia invaded Ukraine, our 2023 Forecast was significantly more bullish calling for a “Choppy Start, Fed Pause Q1, Pre-Election Bull Emerges.
We sure got the choppy start with help from a mini run on some regional banks with too much exposure to crypto, which was in a bear market of its own, and low long-term rates in a rapidly rising rate environment. The Fed kept raising rates a little longer than we anticipated, pausing in July (now stopped in our opinion).
The pre-election year bull market, however, came on with gusto, more than we expected at times. Many of you remember from our monthly webinars and commentaries that one of biggest concerns for our outlook in 2023 was that we were not bullish enough.
All in all, with S&P 500 up 22.4% year-to-date at yesterday’s close, NASDAQ up 41.2%, DJIA at new all-time highs and the small cap Russell 2000 outpacing big caps since the October lows, as they are supposed to, our 2023 Forecast, while not perfect, was on track.
4-Year Cycle & Sitting Presidents Running for Reelection
Since the end of the pandemic seasonality and the 4-year cycle have been firing on all pistons. As you can see in our updated 4-year cycle chart as 2023 winds to a close the market continues to be influenced and driven by the behavioral finance forces of the habitual maneuvers of traders, investors, and money managers with respect to the election cycle and seasonal flows of cash in and out of the market. It’s uncanny how these forces and patterns continue to work in our favor – especially when we use them in conjunction with the rest of our 5 Disciplines: Seasonal, Fundamental, Technical, Monetary and Sentiment.
![[4-year cycle line chart]](/UploadedImage/AIN_0124_20231221_AF_4-Year_Cycle_Line_Chart.jpg)
The chart below of the S&P 500 Seasonal Pattern for Election Years appears on page 11 of the 2024 Almanac. It shows All Election years compared to our STA Aggregate Cycle of all years, election years and 4th years of the decade, election years with a Sitting President Running for reelection and an Open Field, which are years when no sitting president is running. A sitting president running for re-election is the most bullish. This is supported by the historical evidence that incumbent administrations do everything they can to stay in power, see “How the Government Manipulates the Economy to Stay in Power” on page 32 of the 2024 STA.
When a sitting president is running for reelection S&P 500 averages a gain 12.8% in election years since 1949. This is substantially better than when there is an open field with no sitting president in office running, culminating in a loss of -1.5% on average for the year. The market hates uncertainty and with a sitting president running there is a good chance market, economic and civic conditions will likely remain unchanged whereas with an open field there are a great deal of unknowns. 2024 has that power of incumbency going for it.
Four Horsemen of the Economy
The Dow Jones Industrial Average the lead horse of our Four Horsemen of the Economy is leading indeed. While Papa Dow may not be logging the biggest gains of the major indexes this year it has hit new all-time highs. Last year DJIA held up best and this year S&P 500 and NASDAQ lead the charge driven by AI and technology innovation. We suspect that S&P and NAS are on their way to new all-time highs. S&P is only 1% away or 49.81 points. NASDAQ is 7.3% from a new ATH. Small caps and the Russell 2000 have woken up from their long inflation-induced slumber and are leading during this seasonal period as they historically have. As inflation cools and rates come down small caps should benefit.
Consumer Confidence is still suffering from the lagging effects of inflation. The rate of price increases has slowed, but prices are still rising, and many things are still much more expensive than they were and are expected to stay there. The jump in prices over the last few years has been quite significant. Wages have not kept up either. But anecdotally the malls, stores and restaurants in our area have been busy this holiday season.
Looking at our inflation chart of the 6-month exponential moving average of CPI and PPI we are reminded of the old Blood, Sweat & Tears 1968 hit “Spinning Wheel.” “What goes up must come down…” The rate of inflation has clearly come down precipitously while the economy has remained resilient. The pace of GDP growth and economic activity may decelerate some in 2024. It looks like the Fed has engineered the elusive soft landing. They’ve had help from massive government spending and increased productivity from AI, technological innovations and workplace efficiencies.
Amazingly, through the fastest and steepest rate hiking regime in a generation the labor market has remained robust, and unemployment has stayed below 4% for the past two years and down ticked last month to 3.7%. Perhaps all the folks who left the work force during Covid are trickling back into all the businesses that have been clamoring for workers since the pandemic ended.
Santa Claus Rally & January Indicator Trifecta
Yesterday’s selloff was a great setup. Just what the Santa Claus Rally needed. The Street has been buzzing about the Santa Claus Rally for three months now. Most still get it wrong. It’s not the yearend rally, the Q4 rally that runs from Halloween through January. Yes, November, December and January are the best three months of the year, but they are not the Santa Claus Rally. The Santa Claus Rally, while a seasonally bullish period, is really an indicator. It is our first seasonal indicator of the New Year and an integral component of our January Indicator Trifecta.
Santa Claus Rally was devised by Yale Hirsch in 1972 and published in the 1973 Stock Trader’s Almanac. The “Santa Claus Rally” is the last 5 trading days of the year plus the first 2 of New Year. This year it begins on the open on December 22 and lasts until the second trading day of 2024, January 3. Average S&P 500 gains over this seven trading-day range since 1969 are a respectable 1.3%.
Failure to have a Santa Claus Rally tends to precede bear markets or times when stocks could be purchased at lower prices later in the year. Down SCRs were followed by flat years in 1994, 2005 and 2015, two nasty bear markets in 2000 and 2008 and a mild bear that ended in February 2016. As Yale Hirsch’s now famous line states, “If Santa Claus should fail to call, bears may come to Broad and Wall.”
The January Barometer was also devised by Yale Hirsch in 1972 and published in the 1973 Stock Trader’s Almanac. It states that: “As The S&P 500 Goes in January, So Goes the Year.” There have been 12 major errors since 1950, which is an 83.6% accuracy ratio. Including 8 flat years yields a .726 batting average. The 1933 “Lame Duck” Amendment to the constitution is why the JB works. Since 1934, Congress convenes in the first week of January and includes those members newly elected the previous November. Inauguration Day was also moved up from March 4 to January 20.
Being the first month of the year, it’s when people readjust their portfolios, rethink their outlook for the coming year and try to make a fresh start. There is also an increase in cash that flows into the market in January, making market direction even more important. Then there is all the information Wall Street must digest: The State of the Union Address in most years, FOMC meetings, 4th quarter GDP data, earnings, and the plethora of other economic and market data.
We look forward to seeing Santa’s arrival and a positive Santa Claus Rally. Then we will be watching for a positive First Five Days and January Barometer, what we refer to as our January Indicator Trifecta. Until the market says otherwise, we anticipate them all to be positive. But as we always remind readers: if these seasonal indicators are negative and the market does not rally as it normally does during these bullish seasons, we will likely shift to a less bullish posture – if not outright bearish.
Why is the Trifecta so important? Since 1950, when all three January Indicators, Santa Claus Rally, First Five Days and the full-month January Barometer are up, S&P 500 is up 90.3% of the time 28 out of 31 years for an average gain of 17.5%. When one or more of the Trifecta are down the year is up 59.5% of the time, 25 of 42, for a paltry average gain of 2.9%.
As the late Edson Gould said: “If the market does not rally, as it should during bullish seasonal periods, it is a sign that other forces are stronger and that when the seasonal period ends those forces will really have their say.”
On cue the market is hitting new pre-election year annual highs in December and near the last trading day of the year. To be clear we are bullish for 2024 with a sitting president running for reelection. Election years are not as strong as pre-election years, so we do not expect a repeat of the gains we have enjoyed in 2023. We also have a rather contentious political climate this cycle and the makings of a heated presidential election race and campaign, which is likely to create some weakness in the middle of the year during Q2-Q3 during the Worst Six Months of the year.
Sitting presidents have won reelection 15 times and lost 6 in the past 21 occurrences since 1900. Years incumbents won reelection were stronger early in the year. Years incumbent presidents lost suffered weak starts, but finished strong as unpopular administrations were removed (2024 STA page 34). Since 1900 the Dow averages a gain of 8.8% in election years with a sitting president running and 9.9% since 1950.
Pulse of the Market
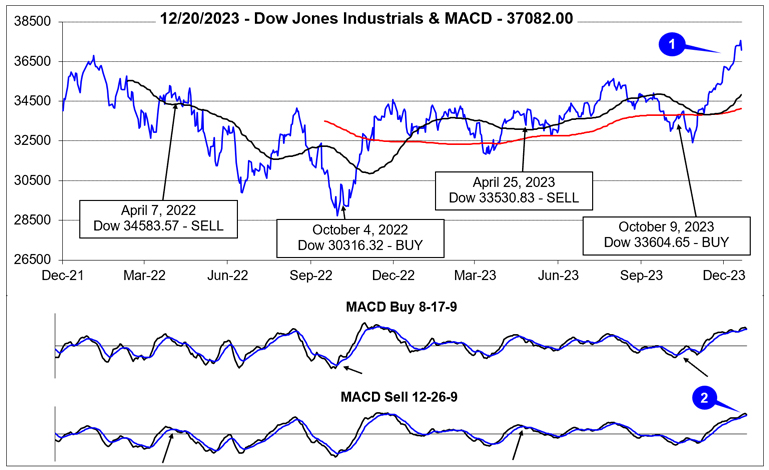
DJIA has broken out to new all-time closing highs, eclipsed 37,000 for the first time ever (1) and is on track to reach our Super Boom target of 38820 by 2025 ahead of schedule. The current rally has been fueled by Fed interest rate cut expectations that were stoked by still cooling inflation. DJIA’s surge higher over the last seven weeks has pushed it well above its 50- and 200-day moving averages and kept both its faster and slower moving MACD indicators positive and headed higher (2).
DJIA (3), S&P 500 (4), and NASDAQ (5) have advanced for seven straight weeks and still stand a solid chance of extending the streak to eight this week. DJIA’s last weekly winning streak of 7 or more consecutive weeks started in December 2018, spanned 9 weeks, and ended in February 2019 with a gain of 16.0%. DJIA’s longest weekly streak since 1950 lasted 14 weeks from August through October 1965. In total, there have been 20 weekly streaks of at least 8 straight. It would not be unprecedented for DJIA to do it once again.
S&P 500 and NASDAQ have similar historical records when comparing weekly winning streaks lasting 7 or more weeks. Longest streaks were 13 weeks for S&P 500 in 1957 and 15 weeks for NASDAQ from December 1971 to March 1972. Based upon history, S&P 500 and NASDAQ could also continue their respective weekly winning streaks this week.
Market breadth over the past three weeks has remained generally bullish with Weekly Advancers outnumbering Weekly Decliners in two of the last three weeks (6). The week ending December 8, was the exception despite all three indexes recording modest weekly gains. Overall, market breadth suggests that there is broad participation in the rally. Every rally needs leadership and broadening participation to keep it going. The current rally does appear to be garnering increased participation.
The trend of Weekly New Highs and New Lows also remains supportive to the rally. Aside from two modest dips, Weekly New Highs have been trending higher since the end of October and have reached their highest level since November 2021. Weekly New Lows have also remained subdued but have ticked slightly higher recently (7). This rise in New Weekly lows appears consistent with impacts of tax-loss selling.
In response to cooling inflation metrics and growth outlooks, the 30-year Treasury bond yield has retreated further. After peaking at 5.02% in late October, it declined to 4.17% last week (8). The 10-year Treasury has also had a similar decline in yield and is back below 4%. The declines in longer-dated interest rates are aiding stocks.
2024 Forecast
Base Case: 85% Probability – Current trends remain intact. Inflation continues to trend back towards the Fed’s stated 2% target. Economic growth slows and employment metrics soften, but recession is avoided as Federal spending continues to support the economy. Power of sitting president running for re-election lifts market to new all-time highs. Average election year gains of 8-15%.
Best Case: 10% Probability – Inflation falls below 2% sooner than expected. Growth and employment soften. No recession, perfect soft landing is achieved, and the Fed lowers rates to achieve neutral monetary policy sooner than expected. Growth then accelerates while inflation remains subdued. Above average gains of 15-25%.
Worst Case: 5% Probability – Geopolitical concerns spiral out of control. Russia – Ukraine war drags on, Israel – Hamas war expands to multiple fronts, and/or China moves to take Taiwan. Inflation does not trend lower and remains elevated longer forcing the Fed to maintain a restrictive money policy stance longer. Economic growth and employment turn negative. Recession begins. Full-year performance negative with broad losses across most asset classes.
The bull market returned in 2023 and is expected to continue through 2024. And our May 2010 Super Boom Forecast when the Dow was around 10,000 for the Dow to reach 38,820 by the year 2025 looks like it’s now running ahead of schedule. (Page 104, Stock Trader’s Almanac 2023.)
Happy Holidays & Happy New Year, we wish you all a healthy and prosperous 2024!