It runs Oct. 5-7 at the Hilton Orlando Lake Buena Vista; a new venue steps from Disney Springs® and Orlando's theme park district.
(https://www.orlandomoneyshow.com/registration/?scode=067844)
More information can be found below.
September Almanac
Portfolio managers returning from vacation after Labor Day have tended to clean house in September. Since 1950, September has been the worst performing month of the year for DJIA, S&P 500, NASDAQ (since 1971), Russell 1000 and Russell 2000 (since 1979). September was creamed four years straight from 1999-2002 after four solid years from 1995-1998 during the dot.com madness. More recently, DJIA, S&P 500, NASDAQ, Russell 1000 and 2000 have been down seven of the last twelve Septembers and four of the last six. Average losses over the last twelve years range from –1.0% by DJIA to –2.0% from Russell 2000.
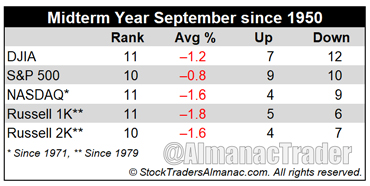
September’s overall rank improves modestly in midterm years going back to 1950, but average losses widen for DJIA (–1.2%), NASDAQ (–1.6%), Russell 1000 (–1.8%) and Russell 2000 (–1.6%). S&P 500’s average September loss in all years is unchanged at –0.8% in midterm years. Hefty declines in September 1974, 2002, and 2022 do weigh on the average decline. Even so, DJIA has declined in 12 of the last 19 midterm-year Septembers.
Although the S&P 500 has advanced 18 times over the last 30 years on September’s first trading day, strength has become rather intermittent more recently with average performance over the last 21 years turning negative (–0.19%). With managers tending to sell underperforming positions ahead of the end of the third quarter there have been some nasty selloffs near month-end over the years. Recent substantial full-month declines occurred following the terrorist attacks in 2001 (DJIA: –11.1%), 2002 (DJIA –12.4%), the collapse of Lehman Brothers in 2008 (DJIA: –6.0%), U.S. debt ceiling debacle in 2011 (DJIA –6.0%) and during the post-covid bear market in 2022 (DJIA –8.8%).
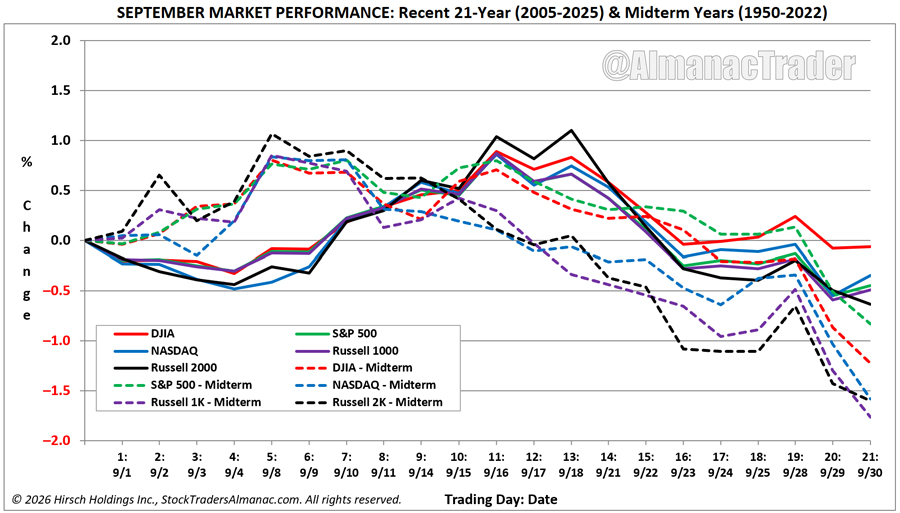
The recent 21-year seasonal pattern for September shows a relatively fair start to September, with most indexes rallying through the first half of the month following a brief bout of weakness during the first four trading days, reaching a peak around mid-September (trading days 11 to 13). From there, performance typically deteriorates, particularly during the final two weeks.
Midterm years show a similar early-month advance beginning at the start of September and peaking sooner, but the subsequent decline is sharper. By the final trading days, midterm-year losses accelerate across all major indexes, with Russell 1000, 2000, and NASDAQ among the weakest.
September Triple Witching week has been generally bullish with S&P 500 advancing better than three times for every two declines since 1990. However, it has suffered some sizable losses, and weekly performance has deteriorated since 2019 with S&P 500 declining in five of the last seven. Triple-Witching Friday was essentially a sure bet for the bulls from 2004 to 2011 but has been a loser nine, eleven, or twelve of the last fourteen years, depending on index with S&P 500 weakest, down 12 of the last 14. The week after Triple Witching has been brutal, S&P 500 down 28 of the last 36, averaging a loss of –0.99%. In 2022, DJIA, S&P 500, and NASDAQ all dropped 4% or more.
Labor Day has become the unofficial end of summer, and the three-day weekend is prime vacation time for many. Business activity ahead of the holiday was more enthusiastic in the old days. From 1950 through 1977 the three days before Labor Day pushed the DJIA higher in 23 of 28 years. Bullishness has since shifted to favor the Wednesday after the holiday as opposed to the days before. DJIA has advanced on 22 of the last 31 Wednesdays following Labor Day. Tuesday after Labor Day also leaned bullish, but DJIA has declined 13 of the last 16 (down the last 9 straight).
Jeff will be joining 75+ market experts over three days to help you prepare for what's ahead. We'll cover the forces shaping the markets — AI-driven innovation, interest rates, inflation, credit conditions, geopolitics, fiscal policy, energy, currencies, commodities, cryptocurrencies, and more — and show you how to put those insights to work in your own portfolio.
You won't just sit in a ballroom. You'll ask questions throughout the conference, meet speakers directly, swap ideas with fellow investors and traders, network at evening receptions, browse the Exhibit Hall, and watch live podcast sessions, social media interviews, and TV broadcasts.
Jeff would love to meet you in person, answer your questions, and share the strategies he is using heading into 2027.
Click here to reserve your pass and join Jeff — and dozens of his fellow market experts — in Orlando this October. Or call the MoneyShow team at 1-800-970-4355 and tell them Jeff sent you.
Hope to see you there.