As summer winds down and the days grow shorter, investors often find themselves humming a familiar tune—not Green Day’s classic, but rather a cautious melody anticipating September’s historical market tendencies. After a remarkably strong year-to-date performance that has largely tracked our annual forecast, the market stands at a crossroads. As Wall Street navigates its toughest month on the calendar amid persistent inflation and Fed uncertainty, the central question arises: will September bring a much-needed “pause that refreshes,” or will it end the market’s hot streak?
The market has enjoyed an impressive run, defying many early-year anxieties. Yet, as we approach the notorious September–October seasonal corridor, a healthy dose of caution is warranted. While we remain cautiously bullish for the balance of 2026, the historical weakness of these months commands respect. With Wall Street’s eyes trained on the Fed’s annual Jackson Hole Economic Policy Symposium, the FOMC’s delicate dance with stubborn inflation, and messaging under the new Warsh Fed regime, unmistakable similarities to the 2018 market environment are emerging. Crucially, both 2026 and 2018 are midterm election years under a Trump administration.
In the accompanying charts of NASDAQ and S&P 500 Seasonal Patterns, we have overlaid 2018 for comparison. The analogs are striking: 2026’s market trend, trajectory, and performance to date are tracking 2018 almost step-for-step.
During President Trump’s first midterm year (2018), the market established a March low driven by tariff announcements and escalating trade war friction with China, which hammered trade-sensitive blue chips and sparked a tech selloff. From there, the typical Trump-era momentum kicked in, propelling the market to new highs by August before consolidating sideways through September and tagging marginal new all-time highs in late September/early October. The Fed then orchestrated the infamous “Christmas Eve Crumble” by hiking rates in December and spooking markets with rigid guidance—most notably when Fed Chair Powell remarked during his December 19 press conference that balance sheet runoff (quantitative tightening) was on “autopilot.”
With the market currently looking somewhat extended against a backdrop of sticky inflation and a murky, newly transitioning Fed regime, this historical Trump midterm script gives us pause. Should the market manage to sidestep an immediate September slide, any significant weakness is more likely to manifest as a late-year correction rather than a typical September selloff. Consequently, we maintain a cautiously bullish near-term stance while keeping a close eye on the calendar risks ahead.
Zooming in on August alone further highlights and reinforces the prevalence of the Trump cycle pattern. As shown in the chart below tracking August market performance under Trump presidency years—specifically 2018—the market has adhered closely to this rhythm.
Beneath the surface, the technical backdrop is showing signs of fatigue. The DJIA and S&P 500 staged bullish breakouts to fresh highs this month, with the S&P resolving upward out of its neutral symmetrical triangle continuation pattern. The Russell 2000 also notched new highs and remains the year’s top performer among the four major benchmarks, though it has cooled over the past three months in line with typical small-cap summer seasonality. In contrast, NASDAQ has failed to confirm with new highs and has now gone 60 trading days without a fresh all-time high.
Furthermore, as illustrated in the technical charts below, the early-August breakout momentum appears to be waning. We have outlined key near-term support levels with thicker red lines near the early-August breakout gaps, late spring/early summer highs, and consolidation zones around S&P 7500, DJIA 52500, and NASDAQ 26000.
Our playbook: respect September’s notorious track record for pullbacks and late Q3 turbulence, and use any seasonal weakness as an entry point to capitalize on the fourth-quarter rally and the impending Sweet Spot of the 4-year cycle (midterm Q4 through pre-election year Q2). However, if the market shrugs off seasonal headwinds and powers higher through September, keep your antennae up for late-arriving “Octoberphobia” and a potentially rocky year-end similar to 2018.
Pulse of the Market
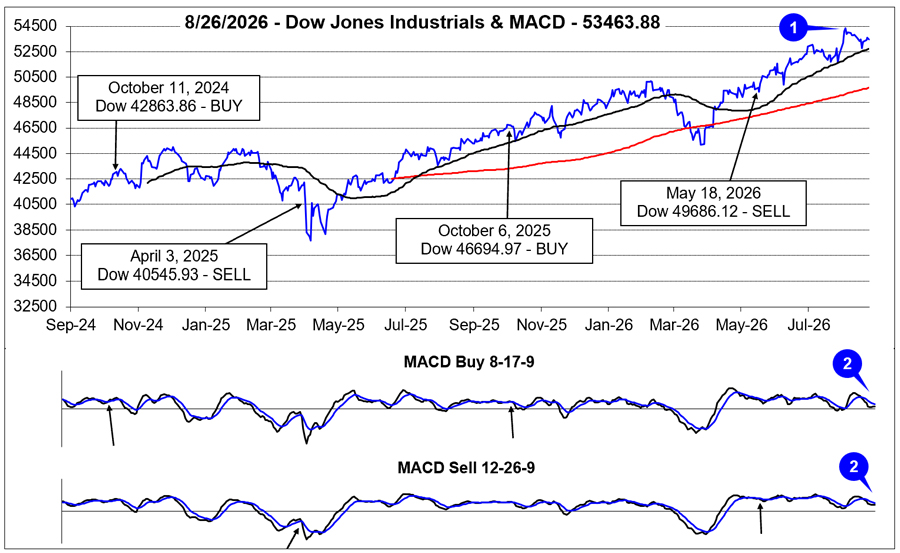
On the heels of a below average midterm-year July (+0.3% this year versus 1.6% in all midterm Julys since 1950), DJIA surged higher over the first three trading days of August to its most recent all-time closing high (1) on August 5 at 54349.12. However, DJIA’s thrust into August quickly ended as interest rate, inflation, and geopolitical concerns reclaimed the headlines. DJIA strength has returned after it found support just above its 50-day moving average on August 20.
DJIA’s loss of positive momentum after closing at new all-time highs in early August was confirmed by both the faster and slower moving MACD indicators (2). Both MACD indicators turned negative in mid-July and have remained so since. DJIA gains this week have slowed MACD’s negative momentum, but more will be needed before MACD can reverse course and confirm DJIA’s change in its short-term trend. Should DJIA’s strength this week fade, MACD would likely resume its course back toward and possibly below the zero line. This would be an ideal setup for DJIA’s Seasonal MACD Buy signal to occur sometime on or after October 1.
After August’s strong first week start, DJIA and the market in general, did pause to consolidate those gains. This was also around the time when the 30-year Treasury bond yield was near multi-decade highs as the national debt topped $40 trillion. This was enough to inject some additional concerns in traders and investors that resulted in DJIA’s seventh Down Friday/Down Monday (DF/DM) warning of 2026 (3) (page 78, STA 2026). Thus far this year, DJIA DF/DM occurrences have seen little downside follow through. Given the longer-term, less sanguine history of DF/DMs, this recent mid-August occurrence still merits caution.
Following three weekly gains in a row, S&P 500 (4) and NASDAQ (5), declined 1.4% and 2.1% respectively last week (week ending August 21). DJIA also fell 0.8% in the week. As of today’s close, August 27, that weekly decline is not likely to become a new losing streak. Late August gains have been common over the last 21-years but September is still the worst month of the year.
Despite DJIA, S&P 500, and Russell 2000 all closing at new all-time highs in August, market breadth (6) has been somewhat lackluster. In the first week of August, when DJIA, S&P 500 and NASDAQ all gained 3% or more, the ratio of Weekly Advancers to Weekly Decliners was just 1.65. Historically, gains of that magnitude have far more Advancers and the ratio has generally been above 2.00. As the number of Weekly Advancers retreats, the result is likely to be smaller and/or limited gains. Possibly more important to watch is Weekly Decliners. Should their number begin to trend higher, broad market weakness could ensue.
New 52-week Highs and Lows (7) are a minor concern. Even with new all-time highs by the indexes in August, New 52-week Highs peaked at just 312 while New 52-week Lows have climbed to 259 (as of week ending Aug 21), their highest level since late March as the market bottomed. If this trend of tepid New 52-week Highs and expanding New 52-week lows persists, the market could be set up for a modest pullback. This aligns well with the weak seasonality of September.
On a weekly basis, the 30-year Treasury bond yield (8) reached its highest level last week since June 2007. In the nearly 20 years that separate those two readings, the 30-year Treasury bond yield averaged just 3.44%. The increase in long-term yields is being driven by persistent inflation and massive Federal deficits and debt. If Treasury bond yields and interest rates can stabilize, the impact to the economy and the market is likely to be manageable. The Fed and U.S. Treasury will certainly be trying their best to ensure that outcome.
Click for larger graphic…