|
January Almanac 2024 & Vital Stats: Softer in Election Years
|
|
By:
Jeffrey A. Hirsch & Christopher Mistal
|
December 28, 2023
|
|
|
|
January has quite a reputation on Wall Street as an influx of cash from yearend bonuses and annual allocations has historically propelled stocks higher. January ranks #1 for NASDAQ (since 1971), but sixth on the S&P 500 and DJIA since 1950. January is the last month of the best three-consecutive-month span and holds a full docket of indicators and seasonalities.
DJIA and S&P rankings did slip from 2000 to 2022 as both indices suffered losses in thirteen of those twenty-four Januarys with three in a row in: 2008 to 2010, 2014 to 2016 and then again from 2020 to 2022. January 2009 has the dubious honor of being the worst January on record for DJIA (-8.8%) and S&P 500 (-8.6%) since 1901 and 1930 respectively. Covid-19 spoiled January in 2020 & 2021 as DJIA, S&P 500, Russell 1000 and Russell 2000 all suffered declines in 2020. In 2021, DJIA, S&P 500 and Russell 1000 declined. In 2022 surging inflation, that reached multi-decade highs, stoked fears of substantially higher interest rates in January. Fears were ultimately validated as a bear market ensued.
Recent January weakness can be seen in the following chart. January has on average started out positive with DJIA, S&P 500, NASDAQ, Russell 1000 and 2000 all logging gains in the first half of the month, but weakness then creeps in. From around the seventh trading day to the end of the month declines have prevailed over the last 21-years.
In election years, Januarys have been weaker. DJIA and S&P 500 slip to number #8 and DJIA average performance dips negative. NASDAQ slips to #4, but average performance remains respectable at 1.7%. Russell 2000’s average performance of 0.8% is the result of all five advancing Januarys gaining over 4% which offsets the losses in six other election-year Januarys.
On pages 112 and 114 of the Stock Trader’s Almanac 2024 we illustrate that the January Effect, where small caps begin to outperform large caps, actually tends to start in mid-December. Historically, the majority of small-cap outperformance is normally done by mid-March, but strength can last until mid-June.
The first indicator to register a reading in January is the Santa Claus Rally. The seven-trading-day period began on the open on December 22 and ends with the close of trading on January 3. Historically, the S&P 500 posts an average gain of 1.3%. The failure of stocks to rally during this time has tended to precede bear markets or times when stocks could be purchased at lower prices later in the New Year.
On January 8, our First Five Days “Early Warning” System will be in. In election years this indicator has a respectable record. In the last 18 election years 15 full years followed the direction of the First Five Days. The full-month January Barometer has a softer record in election years with 12 of the last 18 full years following January’s direction.
Our flagship indicator the January Barometer, created by Yale Hirsch in 1972, simply states that as the S&P goes in January so goes the year. It came into effect in 1934 after the Twentieth Amendment moved the date that new Congresses convene to the first week of January and Presidential inaugurations to January 20.
The long-term record has been solid, an 83.6% accuracy rate, with 12 major errors since 1950. Major errors occurred in the secular bear market years of 1966, 1968, 1982, 2001, 2003, 2009, 2010 and 2014 and again in 2016 as a mini bear came to an end. The tenth major error was in 2018 as a hawkish Fed continued to hike rates even as economic growth slowed and longer-term interest rates fell. Historical levels of support from the Fed and Federal governments in 2020 quickly undid the market damage caused by the Covid induced economic shutdown. 2021 was the 12th major error for the January Barometer as covid-related stimulus and spending propelled the market higher. The market’s position on the last trading day of January will give us a better read on the year to come.
When all three of these indicators agree it has been prudent to heed their call. Since 1950, when all three January Indicators, Santa Claus Rally, First Five Days and the full-month January Barometer are up, S&P 500 is up 90.3% of the time (28 out of 31 years) with an average gain of 17.5%. When one or more of the Trifecta is down the year is up 59.5% of the time (25 of 42) with a paltry average gain of 2.9%.
|
January 2024 Strategy Calendar
|
|
By:
Christopher Mistal
|
December 28, 2023
|
|
|
|
|
Market at a Glance - 12/21/2023
|
|
By:
Christopher Mistal
|
December 21, 2023
|
|
|
|
Please take a moment and register for our member’s only webinar, January 2024 Outlook and Update on Wednesday January 3, 2024, at 2:00 PM EDT here:
Please join us for an Almanac Investor Member’s Only discussion of recent market action with time for Q & A at the end. Jeff and Chris will cover their 2024 Forecast and outlook for January, review the Tactical Seasonal Switching Strategy ETF, Sector Rotation ETF, and Stock Portfolio holdings and trades. We will also share our assessments of the Fed, inflation, the "Best Months" as well as relevant updates to seasonals now in play with a closer look at the status of the Santa Claus Rally and our January Indicator Trifecta.
If you are unable to attend the live event, please still register. Within a day of completion, we will send out an email with links to access the recording and the slides to everyone that registers.
After registering, you will receive a confirmation email containing information about joining the webinar and a reminder message.
Market at a Glance
12/21/2023: Dow 37404.35 | S&P 4746.75 | NASDAQ 14963.87 | Russell 2K 2017.06 | NYSE 16724.92 | Value Line Arith 9972.07
Seasonal: Bullish. January is the last month of the best three consecutive months. Although average performance and rankings have taken a hit due to weakness since 2000, January is still #1 NASDAQ (since 1971) month of the year and #6 for DJIA and S&P 500 (since 1950). Election year Januarys have been mixed and weaker based upon average performance. Our Santa Claus Rally ends on January 3, the First Five Days finish on the eighth and our January Barometer gives its read at month’s end. When all three are positive, our January Indicator Trifecta is nearly perfect with 28 S&P 500 full-year gains in 31 years.
Fundamental: Just right? Atlanta Fed’s GDPNow model is now estimating Q4 growth of 2.7%. Inflation metrics continue to trend toward the Fed’s stated 2% target. Employment data has softened modestly yet remains generally positive. Corporate earnings are forecast to rebound nicely in 2024. Ignoring geopolitical concerns, it appears the economy may be headed toward a soft landing.
Technical: Partial break out. DJIA and NASDAQ 100 have broken out and closed at new all-time highs. S&P 500, NASDAQ Comp, Russell 1000 and Russell 2000 have not. Instead of the leaders getting dragged back down, we suspect they will eventually pull the laggards higher. Weekly breadth remains positive and supportive of an eventual across-the-board break out.
Monetary: 5.25 – 5.50%. Stocks and bonds appear to agree that the Fed is done with hikes. Longer-dated bond yields have fallen substantially, and stocks have surged off their October lows. But monetary policy remains restrictive with short-term rates above 5%. The Fed has reminded multiple times that it remains data dependent. If inflation does reheat, Fed rate cuts could be delayed.
Sentiment: Holiday Cheer. According to
Investor’s Intelligence Advisors Sentiment survey Bullish advisors stand at 56.9%. Correction advisors are at 25.0% while Bearish advisors numbered 18.1% as of their December 20 release. Market gains have pushed bullish sentiment higher. This is not unusual at this time of the year and the market has been up seven weeks straight. At some point the weekly winning streak will end and the market will hit a soft patch that could trigger a retreat in bullish sentiment. Until then, enjoy the yearend rally.
|
2024 Forecast: More New All-Time Highs Anticipated
|
|
By:
Jeffrey A. Hirsch & Christopher Mistal
|
December 21, 2023
|
|
|
|
[Publication Note: The January 2024 Almanac, Vital Stats and Calendar issue will be published next week on December 28, 2023, and sent to subscribers via email after the market close. Happy Holidays and Happy New Year!]
Oxford’s 2023 Word of the Year is “Rizz” a shortened form of charisma. But “Seasonality” may be Wall Street’s 2023 Word of the Year. The seasonal patterns and 4-Year Presidential Election cycle we use as our market guideposts have been tracking quite closely for the past three years and we see no indication that will change anytime soon.
After coming into midterm 2022 cautious and turning bearish after the market did not hit our January Indicator Trifecta and Russia invaded Ukraine, our 2023 Forecast was significantly more bullish calling for a “Choppy Start, Fed Pause Q1, Pre-Election Bull Emerges.
We sure got the choppy start with help from a mini run on some regional banks with too much exposure to crypto, which was in a bear market of its own, and low long-term rates in a rapidly rising rate environment. The Fed kept raising rates a little longer than we anticipated, pausing in July (now stopped in our opinion).
The pre-election year bull market, however, came on with gusto, more than we expected at times. Many of you remember from our monthly webinars and commentaries that one of biggest concerns for our outlook in 2023 was that we were not bullish enough.
All in all, with S&P 500 up 22.4% year-to-date at yesterday’s close, NASDAQ up 41.2%, DJIA at new all-time highs and the small cap Russell 2000 outpacing big caps since the October lows, as they are supposed to, our 2023 Forecast, while not perfect, was on track.
4-Year Cycle & Sitting Presidents Running for Reelection
Since the end of the pandemic seasonality and the 4-year cycle have been firing on all pistons. As you can see in our updated 4-year cycle chart as 2023 winds to a close the market continues to be influenced and driven by the behavioral finance forces of the habitual maneuvers of traders, investors, and money managers with respect to the election cycle and seasonal flows of cash in and out of the market. It’s uncanny how these forces and patterns continue to work in our favor – especially when we use them in conjunction with the rest of our 5 Disciplines: Seasonal, Fundamental, Technical, Monetary and Sentiment.
![[4-year cycle line chart]](/UploadedImage/AIN_0124_20231221_AF_4-Year_Cycle_Line_Chart.jpg)
The chart below of the S&P 500 Seasonal Pattern for Election Years appears on page 11 of the 2024 Almanac. It shows All Election years compared to our STA Aggregate Cycle of all years, election years and 4th years of the decade, election years with a Sitting President Running for reelection and an Open Field, which are years when no sitting president is running. A sitting president running for re-election is the most bullish. This is supported by the historical evidence that incumbent administrations do everything they can to stay in power, see “How the Government Manipulates the Economy to Stay in Power” on page 32 of the 2024 STA.
When a sitting president is running for reelection S&P 500 averages a gain 12.8% in election years since 1949. This is substantially better than when there is an open field with no sitting president in office running, culminating in a loss of -1.5% on average for the year. The market hates uncertainty and with a sitting president running there is a good chance market, economic and civic conditions will likely remain unchanged whereas with an open field there are a great deal of unknowns. 2024 has that power of incumbency going for it.
Four Horsemen of the Economy
The Dow Jones Industrial Average the lead horse of our Four Horsemen of the Economy is leading indeed. While Papa Dow may not be logging the biggest gains of the major indexes this year it has hit new all-time highs. Last year DJIA held up best and this year S&P 500 and NASDAQ lead the charge driven by AI and technology innovation. We suspect that S&P and NAS are on their way to new all-time highs. S&P is only 1% away or 49.81 points. NASDAQ is 7.3% from a new ATH. Small caps and the Russell 2000 have woken up from their long inflation-induced slumber and are leading during this seasonal period as they historically have. As inflation cools and rates come down small caps should benefit.
Consumer Confidence is still suffering from the lagging effects of inflation. The rate of price increases has slowed, but prices are still rising, and many things are still much more expensive than they were and are expected to stay there. The jump in prices over the last few years has been quite significant. Wages have not kept up either. But anecdotally the malls, stores and restaurants in our area have been busy this holiday season.
Looking at our inflation chart of the 6-month exponential moving average of CPI and PPI we are reminded of the old Blood, Sweat & Tears 1968 hit “Spinning Wheel.” “What goes up must come down…” The rate of inflation has clearly come down precipitously while the economy has remained resilient. The pace of GDP growth and economic activity may decelerate some in 2024. It looks like the Fed has engineered the elusive soft landing. They’ve had help from massive government spending and increased productivity from AI, technological innovations and workplace efficiencies.
Amazingly, through the fastest and steepest rate hiking regime in a generation the labor market has remained robust, and unemployment has stayed below 4% for the past two years and down ticked last month to 3.7%. Perhaps all the folks who left the work force during Covid are trickling back into all the businesses that have been clamoring for workers since the pandemic ended.
Santa Claus Rally & January Indicator Trifecta
Yesterday’s selloff was a great setup. Just what the Santa Claus Rally needed. The Street has been buzzing about the Santa Claus Rally for three months now. Most still get it wrong. It’s not the yearend rally, the Q4 rally that runs from Halloween through January. Yes, November, December and January are the best three months of the year, but they are not the Santa Claus Rally. The Santa Claus Rally, while a seasonally bullish period, is really an indicator. It is our first seasonal indicator of the New Year and an integral component of our January Indicator Trifecta.
Santa Claus Rally was devised by Yale Hirsch in 1972 and published in the 1973 Stock Trader’s Almanac. The “Santa Claus Rally” is the last 5 trading days of the year plus the first 2 of New Year. This year it begins on the open on December 22 and lasts until the second trading day of 2024, January 3. Average S&P 500 gains over this seven trading-day range since 1969 are a respectable 1.3%.
Failure to have a Santa Claus Rally tends to precede bear markets or times when stocks could be purchased at lower prices later in the year. Down SCRs were followed by flat years in 1994, 2005 and 2015, two nasty bear markets in 2000 and 2008 and a mild bear that ended in February 2016. As Yale Hirsch’s now famous line states, “If Santa Claus should fail to call, bears may come to Broad and Wall.”
The January Barometer was also devised by Yale Hirsch in 1972 and published in the 1973 Stock Trader’s Almanac. It states that: “As The S&P 500 Goes in January, So Goes the Year.” There have been 12 major errors since 1950, which is an 83.6% accuracy ratio. Including 8 flat years yields a .726 batting average. The 1933 “Lame Duck” Amendment to the constitution is why the JB works. Since 1934, Congress convenes in the first week of January and includes those members newly elected the previous November. Inauguration Day was also moved up from March 4 to January 20.
Being the first month of the year, it’s when people readjust their portfolios, rethink their outlook for the coming year and try to make a fresh start. There is also an increase in cash that flows into the market in January, making market direction even more important. Then there is all the information Wall Street must digest: The State of the Union Address in most years, FOMC meetings, 4th quarter GDP data, earnings, and the plethora of other economic and market data.
We look forward to seeing Santa’s arrival and a positive Santa Claus Rally. Then we will be watching for a positive First Five Days and January Barometer, what we refer to as our January Indicator Trifecta. Until the market says otherwise, we anticipate them all to be positive. But as we always remind readers: if these seasonal indicators are negative and the market does not rally as it normally does during these bullish seasons, we will likely shift to a less bullish posture – if not outright bearish.
Why is the Trifecta so important? Since 1950, when all three January Indicators, Santa Claus Rally, First Five Days and the full-month January Barometer are up, S&P 500 is up 90.3% of the time 28 out of 31 years for an average gain of 17.5%. When one or more of the Trifecta are down the year is up 59.5% of the time, 25 of 42, for a paltry average gain of 2.9%.
As the late Edson Gould said: “If the market does not rally, as it should during bullish seasonal periods, it is a sign that other forces are stronger and that when the seasonal period ends those forces will really have their say.”
On cue the market is hitting new pre-election year annual highs in December and near the last trading day of the year. To be clear we are bullish for 2024 with a sitting president running for reelection. Election years are not as strong as pre-election years, so we do not expect a repeat of the gains we have enjoyed in 2023. We also have a rather contentious political climate this cycle and the makings of a heated presidential election race and campaign, which is likely to create some weakness in the middle of the year during Q2-Q3 during the Worst Six Months of the year.
Sitting presidents have won reelection 15 times and lost 6 in the past 21 occurrences since 1900. Years incumbents won reelection were stronger early in the year. Years incumbent presidents lost suffered weak starts, but finished strong as unpopular administrations were removed (2024 STA page 34). Since 1900 the Dow averages a gain of 8.8% in election years with a sitting president running and 9.9% since 1950.
Pulse of the Market
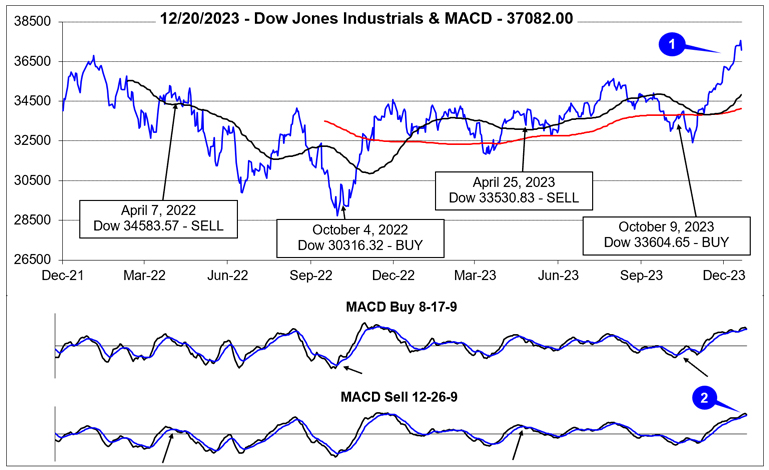
DJIA has broken out to new all-time closing highs, eclipsed 37,000 for the first time ever (1) and is on track to reach our Super Boom target of 38820 by 2025 ahead of schedule. The current rally has been fueled by Fed interest rate cut expectations that were stoked by still cooling inflation. DJIA’s surge higher over the last seven weeks has pushed it well above its 50- and 200-day moving averages and kept both its faster and slower moving MACD indicators positive and headed higher (2).
DJIA (3), S&P 500 (4), and NASDAQ (5) have advanced for seven straight weeks and still stand a solid chance of extending the streak to eight this week. DJIA’s last weekly winning streak of 7 or more consecutive weeks started in December 2018, spanned 9 weeks, and ended in February 2019 with a gain of 16.0%. DJIA’s longest weekly streak since 1950 lasted 14 weeks from August through October 1965. In total, there have been 20 weekly streaks of at least 8 straight. It would not be unprecedented for DJIA to do it once again.
S&P 500 and NASDAQ have similar historical records when comparing weekly winning streaks lasting 7 or more weeks. Longest streaks were 13 weeks for S&P 500 in 1957 and 15 weeks for NASDAQ from December 1971 to March 1972. Based upon history, S&P 500 and NASDAQ could also continue their respective weekly winning streaks this week.
Market breadth over the past three weeks has remained generally bullish with Weekly Advancers outnumbering Weekly Decliners in two of the last three weeks (6). The week ending December 8, was the exception despite all three indexes recording modest weekly gains. Overall, market breadth suggests that there is broad participation in the rally. Every rally needs leadership and broadening participation to keep it going. The current rally does appear to be garnering increased participation.
The trend of Weekly New Highs and New Lows also remains supportive to the rally. Aside from two modest dips, Weekly New Highs have been trending higher since the end of October and have reached their highest level since November 2021. Weekly New Lows have also remained subdued but have ticked slightly higher recently (7). This rise in New Weekly lows appears consistent with impacts of tax-loss selling.
In response to cooling inflation metrics and growth outlooks, the 30-year Treasury bond yield has retreated further. After peaking at 5.02% in late October, it declined to 4.17% last week (8). The 10-year Treasury has also had a similar decline in yield and is back below 4%. The declines in longer-dated interest rates are aiding stocks.
2024 Forecast
Base Case: 85% Probability – Current trends remain intact. Inflation continues to trend back towards the Fed’s stated 2% target. Economic growth slows and employment metrics soften, but recession is avoided as Federal spending continues to support the economy. Power of sitting president running for re-election lifts market to new all-time highs. Average election year gains of 8-15%.
Best Case: 10% Probability – Inflation falls below 2% sooner than expected. Growth and employment soften. No recession, perfect soft landing is achieved, and the Fed lowers rates to achieve neutral monetary policy sooner than expected. Growth then accelerates while inflation remains subdued. Above average gains of 15-25%.
Worst Case: 5% Probability – Geopolitical concerns spiral out of control. Russia – Ukraine war drags on, Israel – Hamas war expands to multiple fronts, and/or China moves to take Taiwan. Inflation does not trend lower and remains elevated longer forcing the Fed to maintain a restrictive money policy stance longer. Economic growth and employment turn negative. Recession begins. Full-year performance negative with broad losses across most asset classes.
The bull market returned in 2023 and is expected to continue through 2024. And our May 2010 Super Boom Forecast when the Dow was around 10,000 for the Dow to reach 38,820 by the year 2025 looks like it’s now running ahead of schedule. (Page 104, Stock Trader’s Almanac 2023.)
Happy Holidays & Happy New Year, we wish you all a healthy and prosperous 2024!
|
2023 Free Lunch Stocks Served: 13 New Lows for Consideration
|
|
By:
Jeffrey A. Hirsch & Christopher Mistal
|
December 16, 2023
|
|
|
|
Our “Free Lunch” strategy is purely a short-term strategy reserved for the nimblest traders. Traders and investors tend to get rid of their losers near yearend for tax loss purposes, often driving these stocks down to bargain levels. Our research has shown that NYSE stocks trading at a new 52-week low on or about December 15 will usually outperform the market by February 15 in the following year. We have found that the most opportune time to compile our list is on the Friday of December quarterly options and index futures expiration – AKA Triple Witching Day.
This strategy takes advantage of several year-end patterns and indicators. First, the stocks selected are usually technically, deeply oversold and poised for a bounce, dead cat or otherwise. Second, many of the stocks are of the small- and mid-cap variety that will benefit from the January Effect which is the tendency for small-caps to outperform large-caps from mid-December through February. Lastly, the strategy spans the usually bullish Santa Claus Rally and the First Five Days of January.
To be included in this list this year, the stock must have traded at a new 52-week low on Friday, December 15, 2023. To remain on the list, the stock had to still be trading at $1.00 or higher as some trading platforms place additional restrictions on trades when shares are below $1.00. Furthermore, the stock must have traded at least 50,000 shares on average over the past 50 days and have a market cap of at least $50 million. Then, any stock that was not down 30% or more from its 52-week high to the 52-week low reached on Friday was also eliminated. Additionally, we selected stocks that had volume on Friday that was at least 1.5x their average daily volume over the past 50 days. Finally, preferred stocks, funds, splits, special high dividends, and new issues (less than 1-year trading) were eliminated. No stocks from the American Stock Exchange made the cut.
Our suggested guidelines for trading these Free Lunch stocks are to initiate a position at a price no greater or less than 3% of Friday’s closing price and to implement a 15% trailing stop on a closing basis from the purchase price. If the stock closes below 15% of the execution price or a subsequent high watermark, then the stock would be closed out of the portfolio. If any of these stocks trade in a window between -3% to +3% of Friday’s closing price on Monday, December 18, it will be tracked in the Almanac Investor Stock Portfolios using the trade’s execution price with a 15% trailing stop on closing basis. We will equally weight and allocate a smaller than usual amount to Free Lunch stocks. Historically, the opportune time to enter these positions has been before the end of the year.
If you buy these stocks, please note the following:
1. Consider selling them as soon as you have a sizable gain and utilize stop losses.
2. The stocks all behave differently and there is no automatic trigger point to sell at.
3. Standard trading rules from the Almanac Investor Stock & ETF Portfolios do not apply for these stocks.
4. We think you should be out of all of these stocks between the middle of January and the middle of February.
5. Also, be careful not to chase these stocks if they have already run away.
DISCLOSURE NOTE: Officers of the Hirsch Organization do not currently own any of the shares mentioned. However, we may participate in the Free Lunch Strategy.
|
Stock Portfolio Update: DJIA Breaks Out & Small Caps Surge
|
|
By:
Christopher Mistal
|
December 14, 2023
|
|
|
|
Aside from the usual year-end holiday cheer, the market finally got what it wanted from the Fed yesterday. DJIA climbed above 37000 to a new all-time closing high while S&P 500 is just 1.63% from its all-time high as of today’s close. NASDAQ, hit the hardest in last year’s bear market, has more ground to recover, but is less than 10% away from its all-time high. S&P 500 could easily eclipse its old highwater mark before yearend and NASDAQ will likely do the same next year, possibly early in Q1.
![[NASDAQ Election Year Seasonal Pattern Chart]](/UploadedImage/AIN_0124_20231214_Election_Year_Seasonal_NASDAQ.jpg)
In the above chart we have plotted the same four seasonal patterns that are in the 2024 Almanac on page 11 using S&P 500 data (please note, NASDAQ data begins in 1971). When compared to the longer history of S&P 500, NASDAQ’s patterns are very similar to S&P 500. The most bullish scenario is when there is a sitting president running for reelection. In those years, NASDAQ has averaged a full-year gain of 19.14%. This is much stronger than the 12.73% average gain in all years and the 8.87% average advance in all election years. Pre-election yearend strength also continues into January and February of election years. We maintain our bullish outlook for the balance of the year.
Stock Portfolio Updates
Over the past four weeks through yesterday’s close (December 13), S&P 500 climbed 4.5% higher while Russell 2000 surged 8.1%. Over the same period the entire stock portfolio advanced 2.1% excluding dividends, any interest on cash and any trading fees. Small-cap portfolio positions performed the best, up 7.5% on average. Large caps were second best, up 5.0%, while Mid-caps advanced 4.2%. Of the 20 new trade ideas presented in November, 18 are higher (11 up double digits), 2 are in the red and the average gain of all 20 is 9.7%.
The top performing new trade idea is Virco Manufacturing (VIRC) up 40.6%. The catalyst for the gains was a well-received earnings report on December 8. Revenue, margins, expenses, and net income all moved in favorable directions. Management also reinstated a quarterly dividend and announced a share repurchase program. VIRC is on Hold. Following a sizable move in a relatively short period of time, it would not be surprising if there was some profit taking in the near term. However, the long-term prospects remain positive.
InterDigital (IDCC), the second best performing new trade idea up 22.3%, is also being pushed higher on the prospects of its recently expanded share repurchase program. On December 6, management announced an expansion of its existing program from $235 million to $300 million. The announcement did drive shares to a new 52-week and new all-time highs. IDCC is on Hold.
Reviewing the third best new position, Armstrong World Industries (AWI), it traded at a new 52-week high today. AWI has been trending higher on the news it is going to be added to the S&P SmallCap 600 index on December 18. Its addition to the index is bullish as ETFs that track the index will need to buy shares. AWI is on Hold.
At the opposite end of the performance spectrum is Daktronics (DAKT). Shares had a nice run just after the basket was released, climbing around 20%, but the run came to an end just after Thanksgiving. What likely started as some profit taking turned into a bigger drop when quarterly earnings came in below expectations last week. Earnings were not all that bad; revenue did grow, and margins did improve. DAKT may have found some support as it is slowly recovering. DAKT is on Hold.
Leonardo DRS (DRS) is the other new position in the red. DRS is an aerospace and defense company. For DRS, the current geopolitical environment is a tailwind, but the delay in authorizing additional funding for Ukraine and funds for Israel by Congress is likely weighing on sentiment. Also potentially dragging on DRS is the sale of 18 million shares by its parent Italian company Leonardo. DRS is on Hold.
All other positions in the portfolio are on hold. Please note that stop losses have been adjusted to account for gains. Since our outlook remains bullish, stop losses do remain generally not that restrictive. Typical
small-cap strength that has historically begun around mid-December appears to have gotten off to an early start this year and we do not want to chase positions at this time. We will also be sending out the annual Free Lunch basket of stocks during the upcoming weekend in advance of the market’s opening on Monday, December 18.
|
ETF Trades: Eyeing Seasonal Lows for Crude Oil and Copper
|
|
By:
Christopher Mistal
|
December 07, 2023
|
|
|
|
For those who were unable to attend the member’s only webinar on Wednesday, the slides and video recording are available
here (or copy and paste in a new browser window:
https://www.stocktradersalmanac.com/LandingPages/webinar-archive.aspx). In addition to the seasonal pattern charts we have been tracking and presenting throughout the year, Jeff reviewed the numerous seasonal indicators and patterns that occur in December and January.
Shortly after first-half December weakness is anticipated to end, we will serve up the annual Free Lunch basket of stocks, page 116 of the Almanac, via email Issue before the market opens on December 18. If you are unfamiliar with Free Lunch, Jeff covered the selection method and seasonal tendencies that support the strategy in detail in the webinar.
At the same time, we will be looking for early signs of small-cap outperformance, pages 112 and 114, followed by our Santa Claus Rally, the First Five Days of January and the full-month January Barometer. Based upon the outcome of these three indicators, we may adjust our outlook for the balance of Q1 and 2024. Until then, we remain bullish as this is the seasonal favorable period for stocks and it appears the Fed may just pull off a soft economic landing. Inflation is cooling, employment data has eased, and economic growth appears to be returning to its longer-term trend line.
Copper’s Bullish Seasonality
Copper tends to make a major seasonal bottom in November/December and then has a tendency to post major seasonal peaks in April or May. This pattern could be due to the buildup of inventories by miners and manufacturers as the construction season begins in late winter to early spring. Auto makers are also preparing for the new car model year that often begins in mid- to late summer. Traders can look to go long a May futures contract on or about December 14 and hold until about February 24. In this trade’s 51-year history, it has worked 34 times for a success rate of 66.7%. The average gain in all years is 5.5%. After four straight years of declines from 2012 to 2015, this trade has been successful in six of the last seven years with solid theoretical gains. In 2020 this trade was a bust as Covid-19 emerged in China.
Cumulative profit, based upon trading a single futures contract excluding commissions and fees, is a respectable $101,450. Slightly less than one-fifth of that profit came in 2007, as the cyclical boom in the commodity market magnified that year’s seasonal price move. However, this trade has produced other big gains per single contract, such as the $16,350 gain from December 2020 to February 2021, and even back in 2011, it registered another substantial $14,475 gain. The worst loss occurred from December 2014 to 2015 when copper declined 11.8% generating a theoretical loss of $8,625. These numbers show this trade can produce big wins and big losses if not properly managed. A basic trailing stop loss could have mitigated many of the historical losses.
![[Long Copper (May) Trade History Table]](/UploadedImage/AIN_0124_20231207_Copper_Trade_History_table.jpg)
In the following chart, the front-month copper futures weekly price moves (top pane), and seasonal pattern (bottom pane) are plotted. Typical seasonal strength in copper is depicted by a black arrow in the lower pane of the chart. Last year’s seasonal period is visible in the top pane of the chart accompanied by a blue arrow. Since copper’s late January peak, it traded lower through October before reversing higher. This new uptrend could continue as falling interest rates spur demand for mortgages, housing, and autos.
![[Copper (HG) Bars and Seasonal Pattern Chart (Weekly Data December 2022 – December 7, 2023)]](/UploadedImage/AIN_0124_20231207_HG_Seasonal.jpg)
One option that provides exposure to the copper futures market without having to have a futures trading account, is United States Copper (CPER). This ETF tracks the daily performance of the SummerHaven Copper Index Total Return index less fund expenses. CPER’s daily volume can be on the light side, but it does appear to be sufficiently liquid with average daily volume jumping above 100,000 shares when copper moves. Stochastic, relative strength and MACD technical indicators applied to CPER are all essentially neutral now but were recently near overbought levels.
A position in CPER can be considered near current levels with a buy limit of $23.10. If purchased an initial stop loss of $20.62 is suggested. This trade will be tracked in the Almanac Investor Sector Rotation ETF Portfolio. For tracking purposes, CPER will be added to the portfolio when it trades below its buy limit.
![[United States Copper (CPER) Daily Bar Chart]](/UploadedImage/AIN_0124_20231207_CPER.jpg)
Another way to gain exposure to copper and its seasonally strong period is through the companies that mine and produce copper. Global X Copper Miners (COPX) holds shares in some of the largest copper miners and producers from across the globe. Its top five holdings as of December 6, 2023, are: KGHM Polska Miedz, Ivanhoe Mines, BHP Group, Antofagasta and Zijin Mining. COPX could be considered near current levels up to a buy limit of $34.50. If purchased, an initial stop loss of $30.79 is suggested. This trade will also be tracked in the Sector Rotation section of the ETF Portfolio. For tracking purposes, COPX will be added to the portfolio when it trades below its buy limit.
New December Sector Seasonality
Oil companies typically come into favor in mid-December and remain so until late April or early May in the following year (black arrow in lower pane). This trade has averaged 11.79%, 11.15%, and 15.70% over the last 25-, 10-, and 5-year periods respectively. Seasonal strength in crude oil companies has also been ending sooner, typically in late April or early May instead of late June or July over the past ten years. As a reminder, this seasonality is not based upon the commodity itself (crude oil or natural gas); rather it is based upon NYSE ARCA Oil & Gas index (XOI). This price-weighted index is composed of major companies that explore and produce oil and gas.
![[NYSE Arca Oil Index (XOI) Weekly Bars and Seasonal Pattern since 11/9/1984]](/UploadedImage/AIN_0124_20231207_XOI_Seasonal.jpg)
SPDR Energy (XLE) is the top pick to trade this seasonal setup. A new position in XLE can be considered on dips with a buy limit of $81.25. Employ an initial stop loss of $72.52. Consider taking profits at the auto-sell price of $99.91. Exxon Mobil is the top holding in XLE at 22.07%. The remaining top five holdings of XLE are Chevron, EOG Resources, ConocoPhillips, and Marathon Petroleum. For tracking purposes, XLE will be added to the portfolio when it trades below its buy limit.
Sector Rotation ETF Portfolio Updates
On seasonal cue, the Sector Rotation ETF portfolio has rebounded to an average gain of 5.2%. Our Seasonal MACD Buy Signal was early this year, but October’s broad market weakness provided ample opportunity to establish positions at better levels. As of the close on December 6, the top performing holding was Vanguard REIT (VNQ), up 10.7%. This gain can be attributed to the brisk decline in the 10-year Treasury bond yield and a corresponding decline in mortgage rates. Should November’s jobs report come inline or softer than anticipated tomorrow, the 10-year Treasury yield could easily fall back below 4%. And it could slip even lower if inflation metrics, CPI and PPI, are inline or better than expected next week.
The decline in longer-dated yields has also been a boon for technology. SPDR Technology (XLK) is the second-best performer, up 7.7% as of the close on December 6. iShares US Technology (IYW) was slightly lagging, up 6.0% yesterday, but has closed the gap some today. Other notable gains include 7.4% by iShares DJ Transports (IYT) and 7.3% by SPDR Financials (XLF).
Telecom’s seasonally favorable period has historically come to an end in late December (page 94 STA). iShares DJ US Telecom (IYZ) is on Hold. All other positions in the Sector Rotation portfolio can still be considered on dips below their respective buy limits. Buy limits have been adjusted for recent gains in the table below.
Tactical Seasonal Switching Strategy ETF Portfolio Updates
The “Best Months” are here, the market has been rallying and we remain bullish as pre-election year 2023 nears its end and on into 2024. This has been our stance since our Seasonal MACD Buy signal criteria was met in October and it has been paying off thus far with the Tactical Seasonal Switching portfolio gain climbing to 5.2% as of the close on December 6. The market has been exhibiting some choppy trading in the first half of December. This was expected and suggested by December’s typical seasonal pattern. Based upon that pattern we are expecting second-half December strength.
From now until second-half strength begins, “Best Months” positions, QQQ, IWM, DIA and SPY can still be considered near current levels up to their respective buy limits.
Disclosure note: Officers of Hirsch Holdings Inc held positions in DIA, IWM, QQQ, and IWM in personal accounts.