|
Market at a Glance 2/26/2015
|
|
By:
Christopher Mistal
|
February 26, 2015
|
|
|
|
2/25/2015: Dow 18224.57 | S&P 2113.86 | NASDAQ 4967.14 | Russell 2K 1235.10 | NYSE 11117.93 | Value Line Arith 4844.90
Psychological: Bullish. January’s losses quickly tempered bullish sentiment that was at or near the highest levels of last year at the end of December. This sentiment reversal put enough cash on the sidelines to fuel February’s rally, but the number of bulls has quickly recovered with the market. There are even more bulls now than there were at the end of 2014, but not a great deal more. Current bullish sentiment readings suggest a dwindling amount of cash (that wants to be invested in stocks) on the sidelines. However, high bullish sentiment has only slowed the rally in recent years, it has not killed it.
Fundamental: Solid. 257,000 and 5.7% were the highlights of the January’s employment report. As long as employment data holds up, consumers will continue to spend and the U.S. economy should remain on sound footing. All is not perfect though. Large multi-national corporations are facing a stronger dollar and tepid demand in many overseas markets while low oil prices are weighing on the energy sector, here and abroad.
Technical: Broken out. It was a tough December and January, but DJIA, S&P 500, NASDAQ and Russell 2000 have broken out to new highs. NASDAQ is less than 100 points from eclipsing its old all-time closing high of 5048.62 set on March 10, 2000. Indices began their vault higher at the start of February and all four are currently well above their respective 50- and 200-day moving averages. Momentum has begun to wane this week, but if the indices can hold breakout levels around DJIA 18000, S&P 500 2090, NASDAQ 4800 and Russell 2000 1215 during this pause, additional new highs are expected.
Monetary: 0-0.25%. Measured, balanced, data-driven and patient are just a few of the dovish words the Fed and its members have been using lately to describe its plan for eventually normalizing monetary policy. This has all added up to a consensus that the Fed’s first rate hike since June of 2006 will not happen until sometime in the second half of 2015, at the earliest, and possible not until 2016. Long live the stock market rally as yield-starved investors has few other choices till then.
Seasonal: Bullish. Normally a decent performing market month, March performs even better in pre-election years. In pre-election years March ranks: 4th best for DJIA, S&P 500, NASDAQ, Russell 1000 and Russell 2000 (January, April and December are better). Pre-election year March has been up 13 in a row for DJIA and 9 in a row for Russell 1000 & 2000. In fact, since inception in 1979, the Russell indices have a perfect, 9-for-9 winning record.
|
Investors Are Jumping and Sentiment Is High, Stocks Are Rich and Our Economy Is Humming
|
|
By:
Jeffrey A. Hirsch & Christopher Mistal
|
February 26, 2015
|
|
|
|
There are two basic types of market indicators: trending indicators and oscillating indicators. Trending indicators signal a move in the same direction such as On Balance Volume, where an increase in volume predicts an increase in price. Oscillating indicators or contrary indicators move inversely to an index, market or security. Sentiment indicators have been used as contrary indicators for years, but their efficacy has always been dubious.
Historically, when market sentiment has been extremely bullish it has preceded a top and a correction or bear market. Conversely, when sentiment is extremely bearish it has preceded a bottom and a rally or new bull market. The CBOE Equity Only Put/Call ratio is a contrary sentiment indicator we have used and tracked for years and is included in the Pulse of the Market below.
However, frankly, it has not been much use of late. The last time it spiked above 1.00, indicating more put buying than call buying (hence excessive fear in the market) was the week ending November 21, 2008. While this was nearly the low point of the market, the ultimate low came more than three months later in March 2009.
Investors Intelligence Advisors Sentiment has been a valuable contrary indicator over the years. So when this week’s numbers came out showing an uptick in the Bullish Advisors % to nearly 60%, the highest since last July, it was cause for concern. However, as illustrated in the charts below of the S&P 500 plotted against the Bullish and Bearish Advisors % it becomes quite clear that the usefulness of this indicator, at least in the near, has been lacking for years. The periods are broken into three to allow for the changes in price range for the S&P.
While a large percentage of bearish advisors in conjunction with a sharp spike have been more likely to accompany a bottom, large percentages of bulls even with sharp spikes have not marked a major top. Bullish sentiment can run quite high and for quite some time before a top is formed and a significant decline begins.
![[S&P 500 V. II % Bulls & Bears]](/UploadedImage/AIN_0315_20150226_Sentiment.jpg)
Ten years ago or more we had to wait for mail to be delivered and analysis to be reported to find out who was bullish and who was bearish. Now we know instantly on Twitter. So it’s no wonder everyone is often in agreement and the oscillating contrary sentiment indicators are merely following the trend of the market. Perhaps now that QE is done and rate hikes are imminent in the US these indicators may become relevant again. But until there is a clear sign that they are, we expect the market to continue higher as per our forecast with a high most likely in the first half of 2015 around Dow 19000, S&P 2250 and NASDAQ 5000, slightly higher or lower than NASDAQ’s all-time high, followed by a move sideways to slightly higher with volatility and corrections and an ultimate high near yearend 2015.
Pulse of the Market
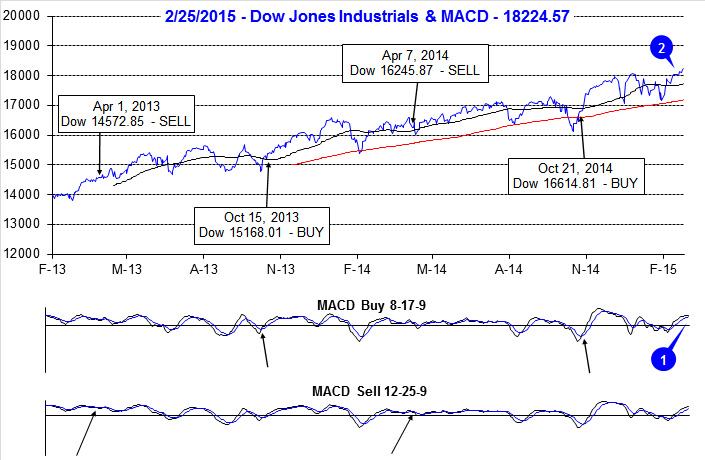
DJIA spent the vast majority of 2015 in the red until mid-February when it finally broke out above 18,000 to new all-time highs (1). The sprint off of late-January lows turned both the faster and slower MACD indicators positive at the start of February (2), but now that momentum has faded these indicators are on the verge of turning negative. The market’s resilience in the face of seemingly endless concerns about Greece’s fate, the standoff between the West and Russia over Ukraine and the growing threat of terrorism suggests underlying strength. And if DJIA can maintain its hold on 18,000, it will likely way find its way to our forecast first-half high of 19,000 in short order.
After starting the year off with four losing weeks out of five, DJIA has been up three straight weeks (3). However, traders are not as fully committed as some data suggests as this streak of winning weeks was accompanied by the second Down Friday/Down Monday (DF/DM) of 2015 (4). Historically, a DF/DM occurrence has been an early warning of weakness to come. This was certainly the case with the first of 2015 when DJIA dropped nearly 600 points from January 9 to January 30. Thus far, the second DF/DM of 2015 has been ignored.
S&P 500 (5) and NASDAQ (6) are also in the midst of a three week winning streak that is currently on its way to be four weeks. After nearly 15 years, NASDAQ is less than 100 points from a new all-time high. This time will be different. NASDAQ valuation metrics today are a far, far cry from what they were in 2000. A repeat of NASDAQ’s collapse at the start of the century is also substantially less likely.
The ratio of Weekly NYSE Advancers to Decliners (7) does not look as strong as the advance made by major indices in recent weeks. Normally this would be cause for concern, but commodities and related companies continue to struggle and are most likely responsible for the narrowing of this ratio. Some evidence of this can be seen in NYSE New Highs (8) for the week ending January 30. During that week, gold, silver and oil all peaked as major indices were hitting the lows of the year. Spiking commodities were boosting related companies then, but now that they are slumping again, New Highs are also falling.
Moody’s AAA Corporate Rate (9) bottomed at 3.36 at the end of January and has since moved higher with Treasury bond yields. Although corporate rates have climbed over 0.40 points in three weeks, they are still low by historical standards. Healthy, large-cap companies are still able to borrow cheaply to maintain or increase stock buybacks and dividends.
|
March 2015 Strategy Calendar
|
|
By:
Christopher Mistal
|
February 24, 2015
|
|
|
|
|
March Almanac: Ides of March Less of a Concern in Pre-Election Years
|
|
By:
Christopher Mistal & Jeffrey A. Hirsch
|
February 24, 2015
|
|
|
|
Turbulent March markets tend to drive prices up early in the month and batter stocks at month end. Julius Caesar failed to heed the famous warning to “beware the Ides of March” but investors have been served well when they have. Stock prices have a propensity to decline, sometimes rather precipitously, during the latter days of the month. In March 2001, DJIA plunged 1469 points (-11.8%) from March 9 to the 22.
March packs a rather busy docket. It is the end of the first quarter, which brings with it Triple Witching and an abundance of portfolio maneuvers from The Street. March Triple-Witching Weeks have been quite bullish in recent years. But the week after is the exact opposite, DJIA down 17 of the last 27 years—and frequently down sharply for an average drop of 0.44%. Notable gains during the week after for DJIA of 4.9% in 2000, 3.1% in 2007, 6.8% in 2009, and 3.1% in 2011 are the rare exceptions to this historically poor performing timeframe.
Normally a decent performing market month, March performs even better in pre-election years (see Vital Statistics table below). In pre-election years March ranks: 4th best for DJIA, S&P 500, NASDAQ, Russell 1000 and Russell 2000 (January, April and December are better). Pre-election year March has been up 13 in a row for DJIA and 9 in a row for Russell 1000 & 2000. In fact, since inception in 1979, the Russell indices have a perfect, 9-for-9 winning record.
Saint Patrick’s Day is March’s sole recurring cultural event. Gains the day before Saint Patrick’s Day have proved to be greater than the day itself and the day after. Perhaps it’s the anticipation of the patron saint’s holiday that boosts the market and the distraction from the parade down Fifth Avenue that causes equity markets to languish. Or maybe it’s the fact that Saint Pat’s usually falls in historically bullish Triple-Witching Week.
Whatever the case, since 1950, the S&P 500 posts an average gain of 0.22% on Saint Patrick’s Day (or the next trading day when it falls on a weekend), a gain of 0.11% the day after and the day before also averages a 0.22% advance. S&P 500 median values are 0.16% on the day before, 0.23% on Saint Patrick’s Day and 0.03% on the day after. In the nine years when St. Patrick’s Day falls on a Tuesday, like this year, since 1950, the day before (Monday) produced an average loss of 0.06%, while Tuesday advanced an average 0.77% and Wednesday 0.29%.
| March (1950-2014) |
| |
DJI |
SP500 |
NASDAQ |
Russell
1K |
Russell 2K |
| Rank |
|
5 |
|
4 |
|
6 |
|
4 |
|
6 |
| #
Up |
|
43 |
|
43 |
|
28 |
|
25 |
|
26 |
| #
Down |
|
22 |
|
22 |
|
16 |
|
11 |
|
10 |
| Average
% |
|
1.1 |
|
1.2 |
|
0.8 |
|
1.1 |
|
1.3 |
| 4-Year Presidential Election Cycle Performance
by % |
| Post-Election |
|
0.4 |
|
0.6 |
|
-0.3 |
|
0.8 |
|
1.2 |
| Mid-Term |
|
1.3 |
|
1.3 |
|
1.7 |
|
2.0 |
|
2.8 |
| Pre-Election |
|
2.2 |
|
2.1 |
|
3.5 |
|
2.4 |
|
3.2 |
| Election |
|
0.6 |
|
0.8 |
|
-1.6 |
|
-0.6 |
|
-2.1 |
| Best & Worst March by % |
| Best |
2000 |
7.8 |
2000 |
9.7 |
2009 |
10.9 |
2000 |
8.9 |
1979 |
9.7 |
| Worst |
1980 |
-9.0 |
1980 |
-10.2 |
1980 |
-17.1 |
1980 |
-11.5 |
1980 |
-18.5 |
| March Weeks by % |
| Best |
3/13/09 |
9.0 |
3/13/09 |
10.7 |
3/13/09 |
10.6 |
3/13/09 |
10.7 |
3/13/09 |
12.0 |
| Worst |
3/16/01 |
-7.7 |
3/6/09 |
-7.0 |
3/16/01 |
-7.9 |
3/6/09 |
-7.1 |
3/6/09 |
-9.8 |
| March Days by % |
| Best |
3/23/09 |
6.8 |
3/23/09 |
7.1 |
3/10/09 |
7.1 |
3/23/09 |
7.0 |
3/23/09 |
8.4 |
| Worst |
3/2/09 |
-4.2 |
3/2/09 |
-4.7 |
3/12/01 |
-6.3 |
3/2/09 |
-4.8 |
3/27/80 |
-6.6 |
| First Trading Day of Expiration Week: 1990-2014 |
| #Up-#Down |
|
18-7 |
|
18-7 |
|
12-13 |
|
16-9 |
|
14-11 |
| Streak |
|
U3 |
|
U3 |
|
U2 |
|
U2 |
|
U2 |
| Avg
% |
|
0.2 |
|
0.1 |
|
-0.3 |
|
0.01 |
|
-0.3 |
| Options Expiration Day: 1990-2014 |
| #Up-#Down |
|
12-13 |
|
15-10 |
|
9-16 |
|
13-12 |
|
8-16 |
| Streak |
|
D3 |
|
D2 |
|
D3 |
|
D2 |
|
D3 |
| Avg
% |
|
0.1 |
|
0.1 |
|
-0.2 |
|
0.03 |
|
-0.2 |
| Options Expiration Week: 1990-2014 |
| #Up-#Down |
|
18-7 |
|
18-7 |
|
15-10 |
|
17-8 |
|
13-12 |
| Streak |
|
U3 |
|
U3 |
|
U3 |
|
U3 |
|
U3 |
| Avg
% |
|
1.0 |
|
0.8 |
|
-0.1 |
|
0.7 |
|
0.1 |
| Week After Options Expiration: 1990-2014 |
| #Up-#Down |
|
10-15 |
|
7-18 |
|
13-12 |
|
7-18 |
|
13-12 |
| Streak |
|
U1 |
|
D3 |
|
D2 |
|
D3 |
|
D3 |
| Avg
% |
|
-0.2 |
|
-0.04 |
|
0.3 |
|
-0.02 |
|
0.3 |
| March 2015 Bullish Days: Data 1994-2014 |
| |
6,
10, 11, 13 |
4,
6, 12, 16-18 |
4,
12, 18, 19 |
4,
6, 12, 17, 18 |
4, 6, 12, 13, 18 |
| |
16,
18, 19 |
24,
25 |
24,
25 |
24,
25 |
23, 25, 31 |
| March 2015 Bearish Days: Data 1994-2014 |
| |
26 |
23,
26, 30 |
3,
5, 20, 26 |
3,
23, 26, 27, 30 |
11, 26 |
| |
|
|
|
|
|
|
ETF Portfolio Updates: Bump Up Stop Losses to Protect Gains
|
|
By:
Christopher Mistal
|
February 19, 2015
|
|
|
|
Welcome Year of the Sheep (or goat or ram depending on location). Although the Chinese New Year is not a major holiday for North America, it most definitely is for our friends and business associates in China, Hong Kong and elsewhere in the Asia and Chinatowns around the world. Celebrations will last up to a month in China impacting all aspects of life there. Business activity will take a hit and due to the fact that China is our second largest trading partner, some impact will likely reach our shores. But, let’s not fret too much because history suggests the “Year of the Sheep” will also be a good year for our markets.
![[DJIA, S&P 500 & NASDAQ Annual Performance by Chinese zodiac]](/UploadedImage/AIN_0315_20150219_Market_Zodiac.jpg)
In the above three tables, DJIA, S&P 500 and NASDAQ annual performance has been aligned with the Chinese zodiac calendar. Annual returns are based upon the Gregorian calendar. Nonetheless, the Year of the Sheep ranks well across all three indices. DJIA’s average performance is damaged by sizable losses in 1907 and 1931, but there has not been a losing “Sheep” year since 1931 and the six subsequent years have racked up an average gain of 16.6%. S&P 500, since 1930, has an identical record with an average gain of 21.8% excluding 1931. NASDAQ’s three “Sheep” years have all been positive and average a whopping 45%.
Portfolio Updates
Following nearly three months of sideways, essentially range bound trading; the market has broken out to new highs and is fighting to hold onto them. Aside from a few select holdings, our ETF portfolio had been similarly range bound. This no longer appears to be the case as the average open position gain has now climbed to 9.0% as of yesterday’s close. Just
two short weeks ago, it was 6%. As a result of this surge higher, numerous stop losses have been raised in order to protect gains. See portfolio below for the latest.
Over the past two weeks, the market has presented opportunities to pick up this month’s
Seasonal Sector Trades ideas at or better than their respective buy limits.
PowerShares DB Gold Double Short (DZZ) was added to the portfolio on February 11 when it traded below $6.80 and
ProShares UltraShort Silver (ZSL) was added two days later at $98.50. Historically, seasonal weakness in both gold and silver has begun in February and lasted until the end of June. This year weakness began in mid-January and gold and silver are currently not that far from their respective lows from last November. If gold or silver do break below their previous lows, substantial upside potential would exist for DZZ and ZSL, but until that occurs
DZZ and ZSL are on Hold.
![[Gold Daily Bar Chart]](/UploadedImage/AIN_0315_20150219_GC_Bar_Chart.jpg)
![[Silver Daily Bar Chart]](/UploadedImage/AIN_0315_20150219_SI_Bar_Chart.jpg)
SPDR Utilities (XLU), this month’s new ETF Trades idea, was added to the portfolio on February 6, when it traded below its buy limit of $46.80. A moderate increase in Treasury bond yields over the past few weeks has put pressure on the interest-rate sensitive holdings of XLU, but a bottoming process appears to have begun. XLU appears to have found support just above its 200-day moving average and it’s Stochastic, relative strength and MACD indicators are showing early signs of turning the corner. XLU could still be considered on dips below $46.00.
![[XLU Daily Bar Chart]](/UploadedImage/AIN_0315_20150219_XLU.jpg)
In spite of all the volatility in the energy markets, our four energy-related ETFs, XLE, FCG, UNG and USO, are now showing an average return of 9%. Only UNG remains in the red with a now modest 1% loss. Further volatility is expected, but so are higher prices for all at least in the near term. Record cold in the Northeast is creating demand for natural gas and putting a strain on inventories while consumers seem to have memory issues and are once again purchasing or considering larger, less fuel efficient vehicles which will ultimately drive demand for crude oil. XLE, FCG, UNG and USO could all be considered on dips.
Disclosure Note: At press time, officers of the Hirsch Organization, or accounts they control held positions in IBB, IWM, IYT, QQQ, SPY, UNG, USO, VNQ, XLF, XLI and XLV.
|
Rebounding Market Lifts Stock Portfolio to New Highs
|
|
By:
Christopher Mistal
|
February 17, 2015
|
|
|
|
Although the market finished essentially flat on the day, it did overcome historically bearish forces on the day before and after Presidents’ Day and now stands at or near new highs. The market has also returned to the green for 2015 and remained there for its longest streak of the year in what is usually the weakest month of the “Best Six Months,” February. The market’s resilience in the face of seemingly endless concerns about Greece’s fate, the standoff between the West and Russia over Ukraine and the growing threat of terrorism further underscores underlying strength.
![[DJIA 7th Year & Pre-Election Year Seasonal Pattern since 1901]](/UploadedImage/AIN_0315_20150217_DJIA-7th.jpg)
![[S&P 500 7th Year & Pre-Election Year Seasonal Pattern since 1930]](/UploadedImage/AIN_0315_20150217_SP500-7th.jpg)
Recent DJIA and S&P 500 strength is evident in the above charts comparing all pre-election years and Seventh years of presidential terms seasonal patterns with 2015 year-to-date overlaid for comparison. From their late-January lows, DJIA and S&P 500 have surged approximately 5% through mid-February. This brings DJIA and S&P 500 back in line with the average historical performance of past Seventh years of presidential terms and just a few percentage points away from average pre-election year performance. Both the Seventh and pre-election year patterns suggest solid gains until early July, albeit with some volatility. Thus far, buying the dips has been the best trade. This is likely to remain the case for at least the remainder of the first half of 2015.
Stock Portfolio Updates
Over the past three and a half weeks since last update, through the market’s close on February 13, S&P 500 jumped 3.2% to close at a new all-time high. Russell 2000 surged 4.9% over the same time period while collectively the three Almanac Investor Stock Portfolios climbed 2.1%. Our portfolio’s gain was held back by its sizable cash position. The Small-cap portfolio was the weakest, up just 1.3%. Our Mid- and Large-cap portfolios fared better, gaining 3.2% and 4.3% respectively.
Much of the Small-cap portfolio’s sluggish performance was the result of a tepid
Free Lunch this year. All eleven remaining Free Lunch stocks were closed out of the portfolio using their respective closing prices from February 3. The remaining small-cap portion of the basket (9 stocks) produced an average gain of 8.4%. However, mid-cap Free Lunch stocks,
Worthington Industries (WOR) and
Stratasys (SSYS) were both sold at a loss. SSYS was closed out for a 31% loss after management reported disappointing earnings and guidance for 2015 that prompted numerous analysts to downgrade the stock.
Hawaiian Holdings (HA) also dealt the Small-cap portfolio a blow on January 30 when it plunged from nearly $27 per share to under $19 the next day. Fourth quarter earnings did beat when one-time items were excluded, but the company spooked investors when it said that the stronger U.S. dollar was likely to have a negative impact on first quarter earnings. As a result of the wild price action, HA was stopped out when it closed below $19.43 on February 3 for an overall gain of 121.1% (half the original position was sold when shares first doubled).
With the market breaking out to new highs, it appears the January-February doldrums have finally passed. Pre-election years have been historically solid and there is still plenty of upside left before our 2015 Annual Forecast highs of DJIA 19000, S&P 500 2200 and NASDAQ 5000 are reached, select positions in the stock portfolio can be considered on dips. See table below for updated Buy Limits and Stop Losses.
Disclosure Note: At press time, officers of the Hirsch Holdings Inc., or the accounts they control, held positions in SJT, SXI, UNH and WLT.
|
What’s Next for the Stock Market?
|
|
By:
Jeffrey A. Hirsch
|
February 12, 2015
|
|
|
|
An interesting chart came across my desk that showed the last two major moves up for the S&P 500 of about 100% from 1996 to 2000 and 2002 to 2007 and the subsequent declines of 49% and 57% respectively. It also has the current ~200% up move since 2009 followed by question marks.
Excellent graphic and conversation piece and it dovetails right into our outlook and long term projection for the next cyclical bear market to be of the garden variety (~20-30%) and to mark the end of the current secular bear and the beginning of the
Next Super Boom. So I ran the numbers on the last two secular bears versus the current one.
One of the implications of the question marks is to strike fear in the hearts of investors that since the current up move is double that of the previous two that the next down leg will be even greater than the last two. I suspect the opposite. As illustrated in the three charts below greater upside magnitude does not necessarily beget greater downside.
Examine the secular bear markets of the 1930s and 1940s and the 1970s and 1980s and see for yourself. I suspect the action of the next cyclical bear market will exhibit similar behavior as the final cyclical bears of the prior secular bears. In the previous two secular bears the first and middle down moves were most severe while the third and final of a more average magnitude.
At the end of the previous two secular bears in 1949 and 1982, at the outset of the secular bull markets and global booms, there was a massive shift in leadership and sector rotation. After WWII at the end of the 1940s the shift went from agriculture to manufacturing – Ike’s “military-industrial complex” he spoke of in his farewell address in 1961. In 1982 it was the shift from manufacturing to integrated circuits, computers, the internet and cellphones.
Over the next few years we will likely begin the next sector rotation from high-tech to the new leadership sectors, which may be biotech, healthcare, energy tech, cyber security or something I cannot possible fathom that is currently under development in someone’s garage or lab.
While I firmly believe there is still upside left in the stock market as per my annual forecast, we do appear to be beginning a topping process that make take many moons, yet may occur later this year or early next year. Whenever the top comes (and we’ll be tracking that in the near term), we expect the bulk of the downside to transpire 2016-18 when the next secular bull is likely to begin.
Let’s face facts. Equities are no longer cheap; stocks are a bit rich by many metrics. The Fed is no longer providing the excessive liquidity as it has been in recent years, while other central banks are getting much easier. The US has benefitted from a weak dollar, which has recently gone from undervalued to fairly-valued. Our long/short equity strategies may help diversify, compliment and protect your existing stock portfolios.
|
Seasonal Sector Trades: Precious Metals Short Opportunities
|
|
By:
Christopher Mistal & Jeffrey A. Hirsch
|
February 10, 2015
|
|
|
|
Over the years silver has peaked in February, most notably so in 1980 when the Hunt Brothers’ plot to corner the silver market was foiled. Our seasonal analysis shows that going short on or about February 20 and holding until about April 25 has worked 32 times in the last 42 years for a win probability of 76.2%. As you can see in the short silver table, the usual February silver break was trumped by the overarching precious metal bull market of 2002–2011 just four times in ten years.
After suffering losses for two years in a row in 2010 and 2011, this trade returned to success with its second best performance in 2012 as precious metals in general fell out of favor. This trade was then highly successful in 2013 and last year.
In the above chart, silver’s weekly price bars appear in the top half of the chart and silver’s seasonal trend since 1972 appears in the bottom half. Typical seasonal weakness is highlighted in yellow. Historically, silver has declined from late-February/early-March until the end of June. This year, typical seasonal weakness appears to have begun early with silver peaking above $18 per ounce in late January.
![[ProShares UltraShort Silver Daily Bar Chart]](/UploadedImage/AIN_0315_20150210_ZSL.jpg)
ProShares UltraShort Silver (ZSL) is an inverse (bearish) ETF that seeks to return two times the inverse of the daily performance of silver bullion, priced in U.S. dollars for delivery in London and is the top choice to trade this seasonality in the Almanac Investor ETF Portfolio. Average daily trading volume can be light, but when silver declines in earnest, trading activity in ZSL does expand quickly. ZSL can be bought on dips below $98.50. If purchased, employ a stop loss of $86.70. Should silver decline to test its lows from last November/December, ZSL could easily trade at a new high above $130.
Gold’s Shrinking Appeal
Seasonally, there is also a weak price period for gold from mid-February until mid to late June. Entering a short position on or about February 20 and holding until March 17 has been a successful trade 24 times in the past 40 years for a success rate of 60.0% with a cumulative profit of $38,420 per futures contract. However, in recent years holding on to the short position established in February longer has been more profitable.
The chart below is a weekly chart of the price of gold with the exchange-traded note (ETN) known as PowerShares DB Gold Double Short (DZZ) overlaid to show the inverse price correlation between the two trading vehicles. The line on the bottom section is the 40-year average seasonal tendency showing the market directional price trend with seasonal weakness highlighted in yellow. DZZ trades 2x the inverse of the daily price change of a single gold futures contract. On an average daily volume basis, DZZ is the most liquid “short” gold ETF or ETN.
As you can see in this next chart, DZZ has already made a clear move higher in response to gold’s retreat from its mid-January highs. Stochastic, relative strength and MACD indicators applied to DZZ have all turned positive confirming the change in trend. DZZ could be bought on dips below $6.80. If purchased a stop loss of $5.98 is suggested. If gold slips back down to $1150 per ounce, then DZZ would likely trade above $8 per share.
Both of today’s new trade ideas will be tracked in the Almanac Investor ETF Portfolio.
Disclosure Note: At press time, officers of the Hirsch Holdings Inc., or accounts they control did not hold a position in ZSL or DZZ, but may buy or sell at any time.
|
ETF Trades: Utility Sector Nears Seasonally Favorable Time
|
|
By:
Christopher Mistal
|
February 05, 2015
|
|
|
|
From the Stock Trader’s Almanac 2015, page 92, Sector Seasonality, there are two sectors that begin their seasonally favorable periods in March: High-Tech and Utilities. High-Tech sector exposure already exists in the Almanac Investor ETF Portfolio. Last year, the Utilities sector started off the year on a near chart-perfect bullish climb from the bottom left to the top right. This trend was briefly interrupted with a period of sideways trading that ran from early May through the beginning of October. Since breaking out to new highs in late-October, the sector has soared. It was one of the top-performing sectors of 2014.
So far this year, Utilities have been a consistent bright spot with a respectable year-to-date gain compared to many other sectors that are currently in the red. Perhaps Utilities are rallying because interest rates are falling and their dividends are attractive or perhaps they are advancing because global growth and deflation concerns are making the sectors highly regulated and stable revenues look like a safe place to park capital. Most likely, Utilities’ success in 2015 is a combination of these reasons and others. As can be seen in the following chart of the Utility Sector Index (UTY), seasonal strength typically begins following an early March bottom and lasts through mid-October. Seasonal factors combined with the current trend suggest the Utilities trade could be profitable still.
![[Utility Sector Index (UTY) Weekly Bars and Seasonal Trend Chart]](/UploadedImage/AIN_0315_20150205_UTY_Seasonal.jpg)
With over $8 billion in assets and average daily trading volumes in excess of 13 million shares per day over the last three months, SPDR Utilities (XLU) is the top choice to hold during Utilities seasonally favorable period. It has a gross expense ratio of just 0.15% and comes with the added kicker of a 3.09% dividend yield. XLU could be bought on dips below $46.80. This is just above projected monthly support (green-dashed line in chart below). Based upon its 15-year average return of 9.4% during its favorable period mid-March to the beginning of October, an auto-sell price of $56.32 is set. If purchased an initial stop loss of $43.31 is suggested.
Portfolio Updates
Although no sector seasonalities come to an end in February, two do in March. Computer Tech’s seasonally weak period ends in the beginning of March and so does Biotech’s seasonally favorable period. There are no positions in the portfolio associated with Computer Tech weakness. However, iShares NASDAQ Biotech (IBB) is up 17% since being added to the portfolio last year at the start of Biotech’s bullish seasonality in August. In an effort to preserve this gain, and possibly benefit from further upside from now until the beginning of March, a 5% trailing stop loss is suggested for IBB. The initial starting point is IBB’s closing price from February 4.
Last month’s new trading ideas, United States Natural Gas (UNG) and First Trust ISE-Revere Natural Gas (FCG), targeting seasonal strength in natural gas, have been added to the portfolio. UNG was down 6.4% while FCG was up 7.5% as of yesterday’s close. UNG and FCG can be considered on dips below their respective buy limits.
Last month’s
Seasonal Sector Trades focused on seasonal strength in oil. United States Oil (USO) was added to the portfolio on January 23 when it traded below $17.00. This initial purchase represents one-third of a total position. Additional USO purchases can be considered on dips below $18.05. Whether or not the ultimate bottom for crude oil has been made or not is still uncertain, but recent trading action suggests it is not much lower than current prices. The potential upside of this trade outweighs the downside risks. A 50% move higher by oil seems substantially more likely than another 50% move lower.
iPath DJ-UBS Copper TR Sub-Index ETN (JJC) was stopped out of the portfolio on January 13 for a 6.5% loss. Typical seasonal strength for copper was trumped by a surging U.S. dollar and global growth concerns this year.
Aside from today’s new trade ideas and energy-related ETFs, this balance of the portfolio is on Hold. February’s historical track record is rather tepid and following a
down January, even weaker.
Disclosure Note: At press time, officers of the Hirsch Organization, or accounts they control held positions in IBB, IWM, IYT, QQQ, SPY, UNG, VNQ, XLF, XLI and XLV.
|
Free Lunch Update: Check Please, Close Out Remaining Positions
|
|
By:
Christopher Mistal
|
February 03, 2015
|
|
|
|
Our “Free Lunch” (page 112 of Stock Trader’s Almanac 2015) strategy is a short-term trade that takes advantage of several yearend and New Year phenomena. Research has shown that NYSE stocks making new 52-week week lows in mid-December, primarily due to yearend tax-loss selling, tend to outperform the NYSE through mid-February. These stocks are selected ahead of the Santa Claus Rally (page 114 STA15) and approximately near the start of the January Effect (page 110 STA15).
Many of the stocks selected for the “Free Lunch” trade are down for good reason. Declining revenue and shrinking profits are most common amongst these names while others may have run into legal or accounting trouble. Once a name pops, profits should be taken and conversely if a name continues lower it should be cut loose quickly. This year’s basket was no exception. BIND Therapeutics (BIND) was one of the first stocks to pop when it traded over $10 per share on January 8. It currently trades around $6.65 while Whiting USA Trust I (WHX) did the exact opposite on January 21 when it plunged 71.2%.
Overall, this year’s basket did come up short when compared to the longer-term history of the strategy, but it still outperformed the broader NYSE index over the same period of time. Plus, even including Stratasys’ (SSYS) decline today, the NASDAQ portion of the basket did well, averaging nearly a 14% gain.
Since the close on December 21, our “Free Lunch” basket of bargain stocks has slipped an average of 0.7% through the close on February 2 compared to a NYSE loss of 2.0%. Today’s market action looks like it will return the overall basket to slightly better than break even. Since the January Effect is largely over and mid-February is rapidly approaching, the time has come to close out the “Free Lunch” trade. Sell ARCO, OXM, SJT, WOR, LOV, BIND, CCIH, HSOL, IMGN, OGXI and SSYS. For tracking purposes, all remaining Free Lunch positions in the Almanac Investor Stock Portfolio will be closed out using today’s closing prices.
As an alternative to simple dumping names that may still be exhibiting strength, tight trailing stop losses could be used.
Disclosure Note: At press time, officers of the Hirsch Organization, or the accounts they control, held positions in SJT and WLT.