|
Market at a Glance - 5/25/2023
|
|
By:
Christopher Mistal
|
May 25, 2023
|
|
|
|
Please take a moment and register for our member’s only webinar, June 2023 Outlook and Update on Wednesday May 31, 2023, at 1:00 PM EDT here:
Please join us for an Almanac Investor Member’s Only discussion of recent market action and an update on NASDAQ's Seasonal MACD Sell (not triggered) with time for Q & A at the end. Jeff and Chris will cover their outlook for June, review the Tactical Seasonal Switching Strategy ETF, Sector Rotation ETF, and Stock Portfolio holdings and trades. We will also share our assessments of the Fed, inflation, recession prospects, debt ceiling as well as relevant updates to seasonals now in play.
If you are unable to attend the live event, please still register. Within a day of completion, we will send out an email with links to access the recording and the slides to everyone that registers.
After registering, you will receive a confirmation email containing information about joining the webinar and a reminder message.
Market at a Glance
5/25/2023: Dow 32764.65 | S&P 4151.28 | NASDAQ 12698.09 | Russell 2K 1754.60 | NYSE 14975.97 | Value Line Arith 8679.52
Seasonal: Neutral. June is the last month of NASDAQ’s Best Eight Months. Historical performance has been tepid for DJIA and S&P 500 while NASDAQ averages 0.8% in June since 1971. In pre-election years, June has been stronger, gains range from 1.1% for DJIA to 2.4% for NASDAQ. NASDAQ has advanced in 8 of the last 13 pre-election year Junes. NASDAQ’s Seasonal MACD Sell Signal can trigger as soon as June 1.
Fundamental: Anemic. Inflation continues to show signs of moderating with year-over-year changes in headline CPI and PPI trending lower. U.S. GDP for Q1 was revised higher to an annual rate of 1.3%. Employment metrics remain firm, but more tech-sector layoffs could pressure broad measures. Corporate earnings were less bad than initially estimated, yet still down from year-ago levels. The Federal debt ceiling is still unresolved with just one week until a potential default.
Technical: Divergent. DJIA and Russell 2000 continue to struggle and are essentially unchanged year-to-date. NASDAQ has charged higher led by a handful of mega-cap stocks. S&P 500 and its heavy exposure to tech has enjoyed modest gains with waning participation. NASDAQ is attempting to break out above its highs from last August, but DJIA, S&P 500 and Russell 2000 are lagging to varying degrees. Absent broader participation, NASDAQ’s breakout is likely to run out of momentum.
Monetary: 5.00 – 5.25%. The Fed did exactly what was widely anticipated it would do at its May meeting, it raised Fed funds by 0.25%. Recent comments by Fed officials appear to indicate another hike could be on its way when it next meets in June. But, according to CME Group’s FedWatch Tool, there is just a 53.9% chance of a 0.25% rate hike in June as of today, May 25. Based upon historical inflation data, the Fed’s 2% target does not seem that realistic. A sounder target may be around 3%, near the long-term average of CPI.
Sentiment: Neutral. According to
Investor’s Intelligence Advisors Sentiment survey Bullish advisors stand at 46.5%. Correction advisors are at 29.6% while Bearish advisors numbered 23.9% as of their May 24 release. Compared to prior weeks, the most recent reading has a modest increase in bulls and a corresponding small retreat in bears and correction advisors. The overall improvement in sentiment is consistent with the market’s recent modest gains during the survey period. Sentiment is neither frothy nor outright fearful, which seems to suggest the market is going to remain rangebound for the time being.
|
June Outlook: Use AI-Driven NASDAQ Best 8 Months Rally to Reposition
|
|
By:
Jeffrey A. Hirsch & Christopher Mistal
|
May 25, 2023
|
|
|
|
AI and the chip stocks are surely conspiring to drive NASDAQ higher during this last leg of NASDAQ’s Best 8 months November-June. AI also stands for Almanac Investor. It is a testament to our seasonal stock screening process that we uncovered Super Micro Computer, Inc. (SMCI) in last November’s stock basket, which is riding the AI wave.
As of today’s close, SMCI is up 152.5% from our buy price and it’s up 121.8% in the last 30 days. In a recent release president and CEO Charles Liang said, “Supermicro continues to lead the industry supporting the demanding needs of AI workloads and modern data centers worldwide.” Their liquid-cooled AI-optimized racks use both Intel and AMD CPUs with NVIDIA GPUs.
Our portfolios are enjoying this AI/Chip-driven rally, but the backdrop over the market remains cautious and still sets up for further sideways action and a likely pullback or correction over the weak summer months, especially after mid-July into the worst two months of the year August and September.
We have created a new NASDAQ’s seasonal pattern chart here that compares the one-year pattern of all NASDAQ years from 1971-2022 with pre-election years along with our STA Aggregate Cycle which is a combination of all years, pre-election years and years ending in three. So far in 2023 NASDAQ is closely tracking the pre-election pattern up 21.3% year-to-date.
All three pattern lines show a distinct mid-July peak and then sideways action through late October before the usual pre-election Q4 strength that often brings annual highs and perhaps even new all-time highs. This is lining up well for our NASDAQ Best 8 Months MACD Seasonal Sell Signal that can occur anytime on or after June 1. Subscribers will of course be emailed when it triggers. This NASDAQ rally is also providing us ample time to reposition our portfolio for the Worst 4 months of the year July-October.
We suspect that by September the folks in Congress will have made a deal with folks in the White House on the debt ceiling and the budget– at least for the time being. They will likely have managed to simultaneously put feathers in the respective caps that they can tout in their next election campaigns that will ramp up in Q4 of this year where the 4-year cycle and the seasonal cycle converge to rally mode.
In the process, however, their machinations will likely keep the market contained in a relatively narrow range. We have added a couple of notes to our 2011 vs. 2023 debt ceiling showdown comparison highlighting both parties’ 2023 negotiation maneuvers are right out of the 2011 playbook. We don’t expect the same degree of market fallout this year since we all saw this movie in 2011.
Unless there really is an impasse and there is no deal. If that were to transpire, our worst-case scenario might come into play. But for now, expect a deal to occur just in time and the market to mark time until September/October before moving significantly higher.
In the meantime, investors and traders are still handicapping the Fed’s next moves which is back to about even money on a hike or pause at the June FOMC meeting. There is also still plenty of recession fear mongering. We don’t see it. The reliable Atlanta Fed’s GDPNow model’s latest estimate for Q2 GDP is 2.9%. Many economists and Fed speakers continue to warn about inflation being persistent. All the inflation metrics we see are trending lower. And we contend we had our recession with the two negative quarters of GDP in 2022 Q1-2.
Another concern for the near term is market internals. As noted in the Pulse below, market breadth has been uninspiring as new highs are not expanding while new lows continue to pop up and remain elevated. In the chart below of the S&P 500 we have overlaid the NYSE Advance/Decline Line. Over the past month as the market has drifted sideways the A/D Line has made lower highs and is trending down. This suggests that stocks in general are running out of steam.
The 3800-4200 range is also highlighted with near term support around 4050 still holding. NASDAQ and big tech may be rallying, but the rest of the market seems tired. As NASDAQ’s Best 8 months comes to a close in June and the current AI/chip craze fades we expect seasonality along with the debt ceiling and economic headwinds to prevail and keep a lid on stocks through summer doldrums.
Pulse of the Market
In the four weeks and a day since issuing our Seasonal MACD Sell for DJIA and S&P 500, DJIA declined 2.3% while S&P 500 gained 2.0% as of May 25 close. Over the same period NASDAQ advanced 7.6% as its “Best Months” last through June. Absent heavy technology exposure, DJIA has struggled in 2023 and is down a little more than 1% year-to-date. DJIA has slipped below its 50- and 200-day moving average as of its close today (1). Both the Buy and Sell MACD indicators applied to DJIA remain negative and have been trending lower since crossing over in late-April confirming the loss of positive momentum (2).
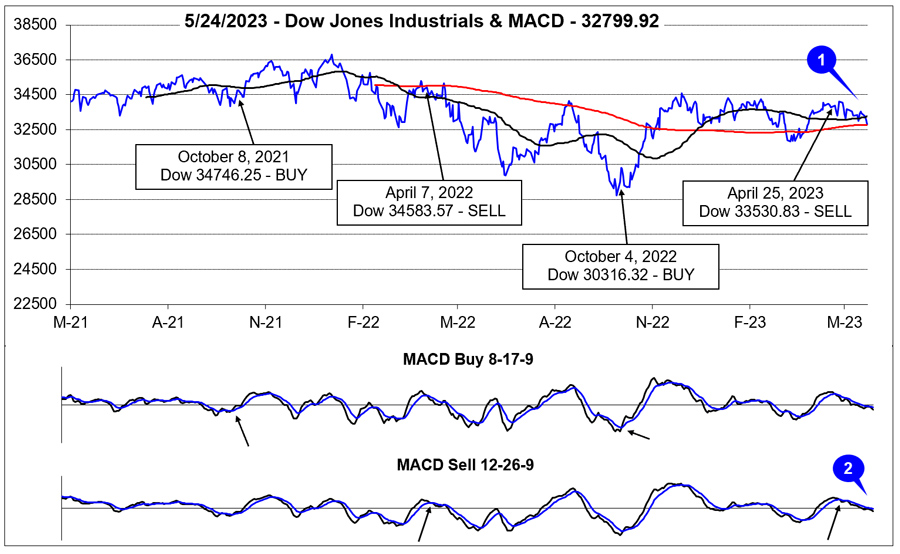
It has been more than two months since DJIA recorded its last Down Friday/Down Monday (DF/DM). The last DJIA DF/DM occurred near the end of a multi-week downtrend. The current DJIA DF/DM (3) came with the major indexes near the top of their respective trading ranges. Thus far, NASDAQ strength has averted further weakness that has historically been observed following a DJIA DF/DM. Should NASDAQ falter, a broader and deeper retreat could unfold quickly.
NASDAQ’s dominance (5) in May is clearly on display in the Pulse table with three straight weekly gains compared to just a single weekly advance for DJIA and S&P 500 (4). With NASDAQ breaking out above last August’s highs, strength could persist into June, the last month of NASDAQ’s Best Eight Months.
Market breadth (6) is an area of concern. Weekly Advancers have been meager over the last seven weeks with just a single week exceeding 2000. Weekly Decliners have been stubbornly elevated. This would suggest momentum is fading and the current rally by NASDAQ could soon suffer a similar fate if Weekly Advancers do not begin to increase.
Weekly New Highs and New Lows are also muddled (7). New Highs have been stuck between 100 and 200 for eight straight weeks while New Lows spiked at the start of May and have retreated modestly. Historically, a healthy rally will see the number of New Highs trend steadily higher and New Lows trend lower. The current trend of both suggests the market is likely to continue to trade in a narrow range.
The Fed’s last rate increase and recent hawkish comments have pushed the weekly 90-day Treasury yield (8) to its highest level since January 2001. One major difference between then and now is the yield on the 30-year Treasury. In 2001, the 30-year Treasury yield was over 5.5% versus the 3.89% it is now. Headline CPI then was around 3.7% and, in an uptrend, compared to 5.0% and trending lower now.
|
June Almanac & Vital Stats: Better in Pre-Election Years
|
|
By:
Jeffrey A. Hirsch & Christopher Mistal
|
May 18, 2023
|
|
|
|
Over the last 52 years June has shone brighter on NASDAQ stocks as a rule ranking eighth best with an 0.8% average gain, up 29 of 52 years (since 1971). This contributes to NASDAQ’s “Best Eight Months” which ends in June. June ranks near the bottom on the Dow Jones Industrials just above September since 1950 with an average loss of 0.2%. S&P 500 performs similarly poorly, ranking ninth, but essentially flat (0.02% average gain). Small caps have also tended to fare well in June. Russell 2000 has averaged 0.6% in the month since 1979 advancing 63.6% of the time. During last year’s bear market, Russell 1000 and 2000 suffered their worst June losses ever, dropping 8.5% and 8.4% respectively. S&P 500 and NASDAQ also dropped over 8% last year.
![[Recent 21-Year June Seasonal Chart]](/UploadedImage/AIN_0623_20230518_June_2023_Seasonal_Chart.jpg)
Over the last twenty-one years, the month of June has been a rather lackluster month for the market. DJIA, S&P 500 and Russell 1000 have all recorded average losses in the month. Russell 2000 has fared better with a modest average gain. Historically the month has opened respectably, advancing on the first and second trading days. From there the market then drifted sideways and lower into negative territory just ahead of mid-month. Here the market rallied to create a nice mid-month bulge that quickly evaporated and returned to losses. The brisk, post, mid-month drop is typically followed by a month end rally led by technology and small caps.
Historical performance in pre-election years has been much stronger with all five indexes finishing with average gains. June’s overall pattern in pre-election is similar to the last 21-years pattern with a brief, shallow pullback after a solid start. In pre-election years the mid-month rally has been much more robust beginning around the sixth trading day and lasting until the fifteenth. Followed by another modest retreat and rally into the end of Q2.
Despite being much stronger in pre-election years, June still ranks mid-pack. For S&P 500 pre-election year June ranks fifth best. For the rest it is just sixth best. Average monthly gains in pre-election year June range from 1.1% by DJIA to a respectable 2.4% from NASDAQ. Russell 2000 has been the most consistently bullish in pre-election years, up 8 of the last 11 (72.7% of the time).
The second Triple Witching Week of the year brings on some volatile trading with losses frequently exceeding gains. On Monday of Triple-Witching Week DJIA has been down fifteen of the last twenty-six years. Triple-Witching Friday is somewhat better, DJIA has been up seventeen of the last thirty-years years, but down seven of the last eight. Full-week performance is choppy as well, littered with greater than 1% moves in both directions. The week after Triple-Witching Day is horrendous. This week has experienced DJIA losses in 27 of the last 33 years with average losses of 0.8%. NASDAQ and Russell 2000 had fared better during the week after, but that trend appears to be fading.
![[June Vital Stats Table]](/UploadedImage/AIN_0623_20230518_June_2023_Vital_Stats_table.jpg)
June’s first trading day is the Dow’s best day of the month, up 27 of the last 35 years. Gains are sparse throughout the remainder of the month until the last three days when NASDAQ and Russell 2000 stocks begin to exhibit strength. The last day of the second quarter was a bit of a paradox as the Dow was down 17 of the last 31 from 1991 through 2014 while NASDAQ and Russell 2000 had nearly the opposite record. Since 2015, all indexes have had a bullish bias on the last trading day, with DJIA and S&P 500 up seven of the last nine.
This will be just the second year the market will be closed in observance of Juneteenth National Independence Day on June 19. Data remains limited and any impact remains to be observed. However, the holiday’s proximity to quarterly options expiration and Father’s Day, could lead to some additional volatility ahead of the long weekend.
|
June 2023 Strategy Calendar
|
|
By:
Christopher Mistal
|
May 18, 2023
|
|
|
|
|
Stock Portfolio Updates: Fed Debt Limit Changes & S&P 500 Performance
|
|
By:
Christopher Mistal
|
May 11, 2023
|
|
|
|
Aside from the Fed and interest rate hikes, we have recently been increasingly concerned about the Federal debt limit drawing comparison to 2011 when S&P 500 peaked on the final trading day of April and fell 19.4% to its final low on October 3. According to Treasury Secretary Janet Yellen’s most recent
letter to Congress on May 1, extraordinary measures currently being used by the U.S. Treasury are likely to be exhausted as soon as June 1. Since the release of this letter, outside analysis by numerous firms supports the deadline given by Secretary Yellen.
Without going into the complex history of the federal debt limit and the politics involved, we tracked down a list of dates that the federal debt limit has been changed. I say changed, because as hard as it is to believe there were times when the limit went down. The debt limit has also used a time component, think of it like the “best by” dates that are commonly found on most items at the local market. And there have been times when the limit was suspended, but the suspension came with an end date. The list of debt limit changes includes times when the limit was changed, date was extended, or when a suspension came to an end. In total, there are 87 previous times since 1950, the federal debt limit has been changed, increased, decreased, time extended, suspended or suspension ended.
![[30 Trading Days Before and 60 Trading Days After Limit Changed Chart]](/UploadedImage/AIN_0623_20230511_Debt_limit_Changes_b4-after_chart.jpg)
In the above chart the average S&P 500 performance the 30 trading days before and 60 trading days after all 87 previous debt limit changes have been plotted across three timeframes. On average, the impact on the S&P 500 has been negligible as most of the debt limit changes occurred without meaningful controversy or crisis. However, in the more recent timeframes, as debate has dragged out to the last minute, the impact appears to be increasing. S&P 500 average performance around recent debt limit changes has slipped, and volatility appears to have increased based upon the choppiness of the Since 1990 blue line.
In the above table the S&P 500 performance over the 1-, 2-week, 1-, 2-, and 3-months after a debt limit change is presented. Generally, the S&P 500 has responded positively following a debt limit change with average gains and the frequency of gains exceeding 60% across all five time ranges. Significant negative performance was seen around the financial crisis of 2008-2009 and in 1987, but there was no meaningful controversary in those years about the debt limit.
The current debt limit dispute and its comparison to 2011 remains a concern. S&P dropped 16.7% in about three weeks from July 22 to August 8 as Moody’s & S&P put the U.S. credit rating on notice in July and then S&P cut the U.S. credit rating August 5. S&P would drop another 1.8% to the October 3 bottom. Secretary Yellen’s projected deadline is quickly approaching. Market volatility is likely to rise and remain elevated until a resolution is reached. We still see a range bound market through the Worst Months. Upside is likely to be limited, but the lows of last year will likely hold.
Stock Portfolio Updates
Over the last four weeks since the last update through yesterday’s close (May 10), S&P 500 advanced 1.1% while Russell 2000 fell 0.8%. Over the same period the entire portfolio slipped 1.4% lower, excluding dividends and any trading fees. Large-cap positions slumped the most, off 5.5%. Mid-caps were only modestly less bad, down 3.7% while our two small caps collectively slipped 2.7%.
After a modest rally in early April, large-cap, healthcare stocks,
Elevance Health (ELV) and
UnitedHealth Group (UNH) retreated briskly. In last week’s issue we examined the
best sectors of the Worst Months. Historically, healthcare is third best by average performance and its frequency of gains at 69.7% is in a three-way tie for third best.
ELV can be considered on dips below $450 while
UNH can be considered on dips below $485. Should ELV and UNH trade below their buy limits, we will officially add to the existing positions.
AT&T (T) also weighed on large-cap performance. Higher interest rates and soft Q1 earnings appear to be the main reasons for recent weakness. T’s main draw is its dividend, but that has faded as interest rates have risen. With many projecting rate cuts from the Fed later this year or early next at the latest, continue to Hold T.
Mid-cap positions were dragged lower by Digi International (DGII) and Perion Network (PERI). DGII has been somewhat of a disappointment since its addition to the portfolio last fall. It was closed out of the portfolio on April 26 after it closed below its stop loss. PERI was the opposite. It had enjoyed solid gains and was nearing its all-time highs in early April. That momentum quickly faded, and PERI was stopped out of the portfolio on May 4.
Super Micro Computer (SMCI) is a bright spot in the portfolio. Earnings were respectable and management issued upbeat guidance which sent shares soaring to a new all-time high last week. SMCI has held the gains and is on Hold.
All positions not previously mentioned are on Hold. DJIA and S&P 500 Worst Months are here. Regional bank woes persist, and the debt limit has not been resolved. We are officially neutral on the market and transitioning to a more cautious stance in the portfolios. When NASDAQ’s Seasonal Sell signal triggers, on or after June 1, we will consider additional defensive measures.
Disclosure note: Officers of Hirsch Holdings Inc hold a position in PR in personal accounts.
|
ETF Trades: Top Sectors of Worst Six Months & Precious Metals
|
|
By:
Christopher Mistal
|
May 04, 2023
|
|
|
|
In case you missed the member’s only webinar on Wednesday, the slides and video recording are available
here (or copy and paste in a new browser window:
https://www.stocktradersalmanac.com/LandingPages/webinar-archive.aspx). In the webinar we reviewed how this year’s debt ceiling showdown eerily compares to 2011, presented and discussed the key seasonal patterns we have been tracking this year, discussed how current regional bank issues are not likely over, and how we anticipate the current Worst Months period to be volatile.
Let’s put aside the market’s recent volatility for a moment today and instead focus on some tactical adjustments that can be made in portfolios to take advantage of what has historically worked during past “Worst Six Months” while considering either shorting or outright avoiding what does not work all that frequently.
In the following table, the performance of the S&P 500 and NASDAQ during the “Worst Six Months” May to October is compared to fourteen select sector indices or sub-indices, gold and the 30-year Treasury bond. Nine of the fourteen indices chosen are S&P Sector indices. Gold and 30-year bond are continuously-linked, non-adjusted front-month futures contracts. Except for two indices, 1990-2022, a full 33 years of data was selected. This selection represents a reasonably balanced number of bull and bear years for each and a long enough timeframe to be statistically significant while representing current trends. In an effort to make an apples-to-apples comparison, dividends are not included in this study.
![[Various Sector Indices & 30-Year Treasury Bond versus S&P 500 during Worst Six Months May-October Since 1990 table]](/UploadedImage/AIN_0623_20230504_Best_Sectors_Worst_Months.jpg)
Using the S&P 500 as the baseline by which all others were compared, five indices outperformed during the “Worst Six Months” while ten others, gold and the 30-year Treasury bond underperformed based upon “AVG %” return. At the top of the list are Biotech and Information Technology with average gains of 7.51% and 4.92% during the “Worst Months.” Before jumping into Biotech positions, consider only 28 years of data was available and, in those years, Biotech was up 57.1% of the time from May through October. Some years, like 2014, gains were massive while in down years losses were frequently nearly as large. Last year’s 5.79% gain by Biotech is notable as it was one of just four sectors to record a gain. It was also second best, outdone by the NYSE ARCA Oil & Gas index.
![[Biotech mini-table]](/UploadedImage/AIN_0623_20230504_Biotech_table.jpg)
Runner-up, Information Technology with 33 years of data and a 69.7% success rate is possibly a less risky choice than Biotech. Its 4.92% AVG % performance comes by way of two fewer losses in five additional years of data. However, five of the nine losses were double digit. The worst loss was 30.88% in 2008. Other double-digit losses were in 1990 and 2000-2002. Prior to last year’s Worst Months’ decline, Information Technology was positive for nine straight. Holding existing tech-related positions with a trailing stop loss is one option to consider.
![[Information Technology mini-table]](/UploadedImage/AIN_0623_20230504_Infotech_table.jpg)
Other “Worst Six” top performers consisted mostly of the usual suspects when defensive sectors are considered. Healthcare and Consumer Staples have bested the S&P 500. Not surprisingly NASDAQ has also performed well, advancing 72.7% of the time with an average gain of 4.63%. NASDAQ’s Best Eight Months include May and June, so it does have an advantage. Although not the best sector by AVG %, Consumer Staples advancing 78.8% of the time is the closest thing to a sure bet for a gain during the “Worst Months.” Of the seven Consumer Staples declines over the last 33 years, only in the bear market years of 2002 and 2008 did the sector suffer a double-digit decline.
![[Consumer Staples mini-table]](/UploadedImage/AIN_0623_20230504_Staples_table.jpg)
At the other end of the performance spectrum we have the sectors to consider shorting or to avoid altogether. The S&P 500 Materials sector was the worst over the past 33 years, shedding an average 1.41% during the “Worst Six.” NYSE ARCA Natural Gas was second worst by average performance, off 0.96%. PHLX Gold/Silver also recorded an average loss. However, based solely upon the percentage of time up, the stocks only, PHLX Gold/Silver index is the most consistent loser of the “Worst Six” advancing just 39.4% of the time. Aside from solid gains in 2012, 2019 and 2020, PHLX Gold/Silver has declined in nine of the last twelve “Worst Six Months.”
![[PHLX Gold/Silver mini-table]](/UploadedImage/AIN_0623_20230504_Gold-Silver-stocks_table.jpg)
Also interesting to note is the fact that every sector, gold and 30-year bonds are all positive in May, on average. It’s not until June when things begin to fall apart for many sectors of the market and the market as a whole. July tends to see a broad bounce, but it tends to be short-lived as August and September tend to be downright ugly on average. It is this window of poor performance that has given October a lift in the past 33 years. Only Biotech, 30-year bonds and gold (futures and gold & silver stocks) manage to post gains in both August and September.
Based upon “% Up” during the “Worst Six Months,” Consumer Staples and Utilities are the top two sectors of the Worst Six Months while NYSE ARCA Natural Gas and Gold/Silver mining stocks are the worst. Historically speaking, May looks like a great time to consider rebalancing a portfolio as you will likely be closing out long positions into strength. Short trade ideas are also worth considering given June’s nearly across-the-board poor performance.
Sector Rotation ETF Portfolio New Trades & Update
Considering the above and reviewing the current holdings of the Sector Rotation portfolio, updated with yesterday’s closes, we will look to add to the existing position in SPDR Consumer Staples (XLP). Additional purchases of XLP can be considered on dips below the buy limit of $76.15. We will add to the existing position in SPDR Utilities (XLU), the second-best sector during the “Worst Months” based upon frequency of gains. XLU can be considered on dips below $67.35.
Based upon average gain, biotech and healthcare are also worthy of consideration. SPDR S&P Biotech (XBI) can be considered on dips up to its buy limit of $83.25 while SPDR Healthcare (XLV) can be purchased on pullbacks below a buy limit of $131.50. XBI had a solid April and is off to a strong May. iShares Biotech (IBB) can also be considered on dips below $130.00.
These next three trade ideas are not as well supported by the data above, but the current setup does make them worth consideration. Gold is on the verge of breaking out to new all-time highs as banking uncertainties swell and the debt ceiling deadline nears. Gold is also likely to benefit from the weakening US dollar. Silver has much further to go before it reaches its old all-time highs, but it will likely enjoy solid gains should gold break out. If gold and silver do make sizable moves higher, then the miners may also catch up.
SPDR Gold (GLD) can be considered on a dip below $186.50 or on a breakout above $193.50. If purchased a stop loss at $177.18 is suggested.
iShares Silver (SLV) can be considered on a dip below $23.10 or on a breakout above $24.50. If purchased a stop loss at $21.95 is suggested.
Market Vectors Gold Miners (GDX) can be considered on a dip below $34.00 or on a breakout above $36.50. If purchased a stop loss at $32.30 is suggested.
Per our
Seasonal MACD Sell signal email sent after the close on April 25,
iShares DJ Transports (IYT),
SPDR Industrials (XLI) and
SPDR Materials (XLB) have been closed out of the Sector Rotation portfolio using their average prices on April 26. The average gain of these three trades, excluding dividends and fees, was 11.5%.
All other positions in the portfolio are on Hold. Please note that some stop losses have been adjusted in the Sector Rotation table below. As a reminder, stop losses are based upon closing prices. If a position closes below its stop, consider closing it out the next trading day using a limit order at the stop loss price or better (higher). It is not uncommon for a position to bounce the next trading day. If the sell order does not get executed, our suggestion is to utilize your trading skills to close out the position.
Tactical Seasonal Switching Strategy Portfolio Update
Per our
Seasonal MACD Sell signal email SPDR DJIA (DIA) and
SPDR S&P 500 (SPY) have been closed out of the Tactical Seasonal Switching Strategy portfolio using their average prices on April 26, logging a 9.5% average gain excluding dividends and fees. This is inline with historical Best Months performance for all years and extends the midterm-year track record to 19-0.
Partial positions in bond ETFs, TLT, AGG, BND, SHV and SGOV have also been added to the portfolio. Our plan is to add to these positions when NASDAQ’s Seasonal Sell signal triggers sometime on or after June 1. Continue to Hold QQQ and IWM.