|
Market at a Glance - 6/24/2021
|
|
By:
Christopher Mistal
|
--
|
|
|
|
6/24/2021: Dow 34196.82 | S&P 4266.49 | NASDAQ 14369.71 | Russell 2K 2333.62 | NYSE 16558.62 | Value Line Arith 9728.68
Fundamental: Positive. Employment metrics are broadly positive and trending in favorable directions. Initial weekly claims have bounced off of recent lows, but there has been no major spike. Earnings forecasts are encouraging, and corporate guidance will likely be generally positive as overall vaccination rates in the U.S. continue to climb and restrictions are being eased or dropped all together. Q2 GDP is currently estimated to be 9.7% according to the Atlanta Fed’s GDPNow. Headwinds remain. COVID-19 variants, inflation, supply chain issues and year-over-year comparisons will get tougher as the pandemic induced trough slips further into history.
Technical: Rotating? NASDAQ and S&P 500 have closed at new all-time highs this month. DJIA has not. Slipping and stabilizing Treasury yields are lifting growth stocks while interest in value stocks wanes. This appears to be the unwinding of the rotation that took place earlier this year as rates climbed higher. In the time since, major indexes have been essentially trading sideways. Without across the board new all-time highs and a meaningful breakout, more sideways trading with a mild upside bias is likely.
Monetary: 0 – 0.25%. Fed is still highly accommodative and fully committed to supporting the economy, the labor market, and the market; whatever the cost maybe in the long-term. The biggest development out of the most recent meeting was an indication that rate hikes could be coming somewhat sooner. The Fed is now projecting hikes in 2023 instead of 2024.
Seasonal: Neutral. July is the first month of the second half of the year and has the most bullish record in Q3. Post-election-year Julys rank #1 for DJIA, S&P 500 and NASDAQ. But July is also the first month of NASDAQ’s “Worst Four Months” and early July strength has a tendency to fade around mid-month. NASDAQ’s Mid-Year Rally ends on the close on July 14.
Psychological: Borderline Euphoric. According to
Investor’s Intelligence Advisors Sentiment survey Bullish advisors have risen to 56.5%. Correction advisors have declined to 27.7% while Bearish advisors fell to 15.8%. The outright lack of Bearish advisors is worrisome from a contrary viewpoint. Currently there are the fewest numbers of Bears since 2018. Their numbers have not dwindled to the lows of 2018, just prior to the market correction, but the trend in that direction warrants caution and maintaining seasonally defensive maneuvers taken already or planned to be taken.
|
July Outlook: Midyear Rally Yields To Doldrums Mid-July
|
|
By:
Jeffrey A. Hirsch & Christopher Mistal
|
June 24, 2021
|
|
|
|
The rotation back into tech and growth stocks has picked up momentum on the prospects that recent rampant inflation fears are a bit overblown. The retreat in Treasury bond yields and the more tranquil bond market suggests the spike in prices is more transitory than the extremes some market observers and investors have been suggesting. In turn,
NASDAQ’s midyear rally appears to be running ahead of schedule.
We remain in the transitory inflation camp. Sure it will likely be higher than the recent past. The recent uptick of 5% CPI growth is more a product of the historic reopening. The job market, especially in the service industry, remains tight. The service industry was clearly hit the hardest. Soaring demand as the economy reopened quickly caught a lot of businesses flat-footed. Price gains also reflect temporary supply bottlenecks and sharp price drops in 2020 make inflation comparisons to 2021 look larger. When the dust settles the rate of inflation is likely to cool down later this year if the bond market is any indication.
Seasonality and cycles have been back on track since September 2020, but pent-up demand, free money, business innovation and some stellar science that created the vaccines have continued to keep stock prices elevated during the first two months of the Worst Six Months. This red-hot economy is not likely to cool down until next year. However, we do expect a pause and some sideways movement after mid-July.
In the updated chart here of the “S&P 500 One-Year Seasonal Pattern” we have highlighted the midyear rally with a yellow oval. Also noted is the mid-July peak. It is after this peak that the “
Summer Market Volume Doldrums” detailed on page 48 of the
2021 Almanac begins in earnest.
If we have truly made it to the other side of the pandemic and the market and economy are beginning to return to their normal cycles and seasonal patterns, the prospects for a pullback during August and September are higher as illustrated by the red line post-election year pattern. Post-election year Augusts rank #11 for S&P 500 and NASDAQ, and #12 for the Dow. September is not much better in post-election years ranking 9th for S&P 500 and DJIA, 10th for NASDAQ.
NASDAQ Best 8 MACD Sell Signal Update
Our bias for the year remains clearly bullish in keeping with the base and best case scenarios of our
December 17, 2020, 2021 Annual Forecast and we still expect to see the S&P 500 finish the year above current levels in the 4300-4500 range or higher. But after mid-July the market is poised for a pullback during the weaker end-of-summer months August and September as perennial vacation and leisure seasons kicks into post-pandemic high gear.
We are still waiting for our NASDAQ Best 8 Months MACD Seasonal Sell Signal to trigger. Until it triggers we remain in our neutral stance. We have trimmed our stock and ETF portfolios a bit since the Best Six Months Sell Signal on April 22, but many of our defensive stocks and ETFs are on buy and below their buy limits. So check our latest stock and ETF updates and the “Current Advice” in the portfolios. With NASDAQ’s midyear rally picking up steam at today’s close it would take a one-day decline of 475.36 points or 3.31%
Today’s news on the deal struck between President Biden and the bipartisan Senate infrastructure group for a major infrastructure initiative is long overdue and welcome news indeed. We have been clamoring for this for years over the past several administrations. If they can really pull it off it will be a boon for the country, the economy and market over the long haul. We are rooting for this, but delays, setbacks and partisan bickering could spur a market pullback.
Positives abound with improving employment numbers, robust GDP forecasts, strong earnings and guidance from Wall Street and rising vaccine rates. But negatives from inflation, international machinations especially with China, Russia and Iran, Covid-19 variants, supply bottlenecks and tougher year-over-year comps. Consider using this midyear rally to reposition your portfolio for the August/September summer doldrums and prepare to pounce on our next Best 6/8 Months Buy Signal for the yearend rally.
Pulse of the Market
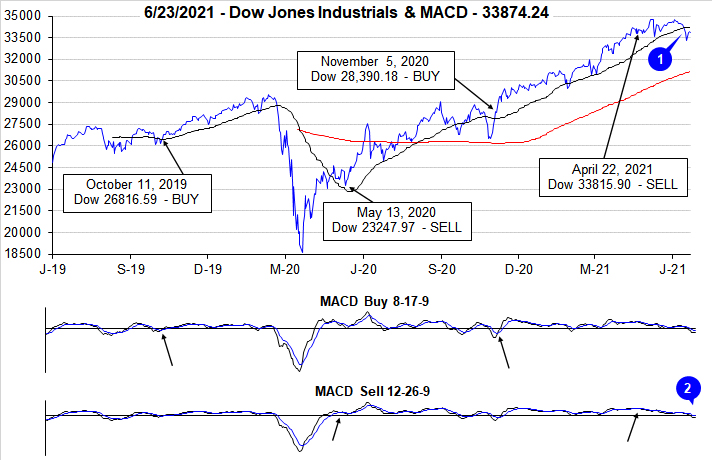
Historically, June has been a challenging month for DJIA, especially in post-election years. That was certainly the situation earlier this month as DJIA shed nearly 1500 points (–4.2%) from its June 4 closing high through its June 18 closing low. During the slide lower, DJIA did fall below its 50-day moving average (1) by the largest margin since last October. DJIA has rebounded this week but has not yet reclaimed its 50-day moving average. DJIA’s recent weakness has kept both the faster and slower moving MACD indicators (2) negative and still generally trending lower.
Since issuing our Seasonal MACD Sell, DJIA (3) has only advanced three weeks of the last nine. S&P 500 (4) and NASDAQ (5) have also exhibited choppy trading over the last nine weeks however they have been modestly healthier with five and four weekly gains respectively. This type of trading is common during May/June especially following solid, above average gains during the “Best Six Month.” NASDAQ has closed at new all-time highs this week and S&P 500 has done the same today.
In spite of general market softness over the last nine weeks, market breadth measured by NYSE Weekly Advancers and NYSE Weekly Decliners (6) was positive in seven of the last nine weeks. This pattern is consistent with the extensive support the economy and market have, and continue to receive, from monetary and fiscal policy. As long as the Weekly Advance/Decline remains positive, the market is not likely to experience any significant or prolonged retreat.
Weekly New Highs (7) continue to run below their peak reached in mid-March at 951. A reading above this level would suggest the market is poised to make a sizable move higher while readings below that level suggest sideways to only modestly higher levels. New Weekly Lows are also remaining stubbornly elevated which also hints at continued sideways trading with a slight bias to the upside.
Many metrics of inflation have been running hot but the Treasury bond market and the 30-year Treasury bond yield (8) do not appear to believe higher levels of inflation are back and here to stay. The stabilization and recent down trend in yields has breathed new life into growth stocks which is confirmed by the NASDAQ reaching new all-time highs this week. Low rates, ample liquidity and fiscal stimulus are providing a solid floor of support under the market reducing the risk of any major market downturn in the near-term.
|
July Almanac, Stats & Calendar: Best Month of Post-Election Years
|
|
By:
Jeffrey A. Hirsch & Christopher Mistal
|
June 17, 2021
|
|
|
|
July historically is the best performing month of the third quarter however, the mostly negative results in August and September tend to make the comparison easy. Two “hot” Julys in 2009 and 2010 where DJIA and S&P 500 both gained greater than 6% and strong performances in 2013 and 2018 have boosted July’s average gains since 1950 to 1.3% and 1.1% respectively. Such strength inevitability stirs talk of a “summer rally”, but beware the hype, as it has historically been the weakest rally of all seasons (page 74, Stock Trader’s Almanac 2021).
July begins NASDAQ’s worst four months and is the fifth weakest performing NASDAQ month since 1971, posting a 0.6% average gain. Dynamic trading often accompanies the first full month of summer as the beginning of the second half of the year brings an inflow of new capital. This creates a bullish beginning, a soft week after options expiration and some strength towards the end.
July’s first trading day is the third best performing first trading day of all twelve months with DJIA gaining a cumulative 1215.30 points since 1998. Over the past 21 years, DJIA’s first trading day of July has produced gains 76.2% of the time with an average advance of 0.33%. S&P 500 has advanced 85.7% of the time (average gain 0.37%). NASDAQ has been slightly weaker at 76.2% (0.27% average gain). No other day of the year exhibits this amount of across-the-board strength which makes a case for declaring the first trading day of July the most consistently bullish day of the year over the past 21 years.
Trading on the day before and after the Independence Day holiday is often lackluster. Volume tends to decline on either side of the holiday as vacations begin early and/or finish late. Since 1980, DJIA, S&P 500, NASDAQ and Russell 2000 have recorded net losses on the day after.
Post-election year Julys rank at or near the top of all post-election year months. DJIA, S&P 500, and NASDAQ are ranked #1. Russell 2000 ranks #2. Delving deeper into this data revealed that many of these past “hot” Julys were preceded by a flat or down first half of the year so there is no guarantee that this July will live up to its historical post-election year record again this year.
NASDAQ Seasonal MACD Update
As of today’s close, NASDAQ’s MACD indicator remains positive and it would take a one-day loss of 520.13 NASDAQ points (–3.67%) to turn it negative.
When NASDAQ’s MACD Sell indicator turns negative, we will issue our NASDAQ Seasonal MACD Sell signal and begin clearing out remaining technology and/or small-cap positions held in the Almanac Investor ETF Portfolios. Until that time, all related positions are on Hold.
|
July 2021 Strategy Calendar
|
|
By:
Christopher Mistal
|
June 17, 2021
|
|
|
|
|
Stock Portfolio & NASDAQ Best Months Updates: Small Caps & Tech Rebound
|
|
By:
Christopher Mistal
|
June 10, 2021
|
|
|
|
One of our favorite charts to get a quick read on the overall health of the market is a simple comparison of DJIA, S&P 500, NASDAQ and Russell 2000 performance to cumulative advance/decline lines. From late October’s low through mid-February all four indexes moved nicely higher essentially in unison. Advance/decline lines were also all trending higher. It was in mid-February that NASDAQ turned briskly lower. Its advance/decline line also turned lower.
![[Advance/Decline Line Chart with DJIA, S&P 500, NASDAQ and Russell 2000]](/UploadedImage/AIN_0721_20210610_AD_Line_Chart.jpg)
When NASDAQ turned and its advance/decline began trending lower, DJIA, S&P 500 and Russell 2000 essentially went nowhere and traded in a range. Bullishly, it appears NASDAQ’s advance/decline line appears to have bottomed in mid-May and is on the verge of eclipsing its peak from February. Broad participation across all the major indexes is a bullish sign and is generally indicative of a healthy move higher is underway. S&P 500 closed at a new all-time high today. DJIA, NASDAQ and Russell 2000 are closing in on their respective all-time highs.
In the near-term, new all-times are likely. However, June is the last month of NASDAQ’s “Best Eight Months” and historically soon after the start of the second half of the year, around mid-July, markets have stalled out and tended to slip into a sideways to lower trend. Inflation trends and the Fed are two possible catalysts that could clip the market’s wings this year. Inflation could prove to be more than just transitory and at some point, perhaps sooner than expected, the Fed will likely begin tapering asset purchases.
NASDAQ Seasonal MACD Update
In the chart below, NASDAQ’s Seasonal MACD Sell turned positive shortly after its advance/decline line turned up in May. It has remained positive since then and recent strength has reversed last weeks negative trend displayed by shrinking histogram bars. As of today’s close, it would take a one-day loss of 713.66 NASDAQ points (–5.09%) to turn its MACD indicator negative.
When NASDAQ’s MACD Sell indicator turns negative, we will issue our NASDAQ Seasonal MACD Sell signal and begin clearing out remaining technology and/or small-cap positions held in the Almanac Investor ETF Portfolios. Until that time, all related positions are on Hold.
Portfolio Updates
Over the last four weeks since last update through yesterday’s close, S&P 500 climbed 3.9% higher while Russell 2000 jumped 9.0%. During the same time period the entire portfolio climbed 2.2% higher excluding dividends and any fees. Overall portfolio performance was held in check by its cash balance and exposure to numerous defensive positions. The bulk of the overall portfolio gains were the result of advances in the Small-cap portfolio. Avid Tech Inc (AVID) produced a sizable portion of the gain and is currently the best position in the portfolio, up 163.1% after selling half the original position when it first doubled.
Overall, small caps are still the standout in the portfolio, up on average 88.2%. Four of the positions held are up triple digits. KB Home (KBH), WSFS Financial Corp (WSFS) and Customers Bancorp (CUBI) join AVID all up over 100%. With the exception of AVID, they are modestly lower today as the Russell 2000 has given way to NASDAQ today. Another standout recently, MGP Ingredients (MGPI), jumped over 22% since last update. MGPI’s most recent earnings (and the prior three) all beat estimates, but the current release was a home run as reported earnings were nearly double the consensus.
Mid-cap positions advanced 1.8% over the last four weeks.
Algonquin Power (AQN) was a suggested
buy last update and
can still be considered on dips below its buy limit of $15.45. AQN has recovered nicely since its mid-May low and appears to be gaining momentum. At current prices its valuation remains quite reasonable and its dividend yield is quite attractive at over twice the rate a 10-year Treasury currently pays.
JetBlue Airways (JBLU) is still the top-performing position in the Mid-Cap portfolio, up 110.1%. JBLU is on Hold. We have previously noted that the bulk of potential gains from JBLU have likely already been achieved. Should JBLU make another run back above $20, it might be time to consider closing out the position. In the meantime, a reasonable tight stop loss remains in place and should preserve the bulk of the gains so far.
Valmont Industries (VMI) is the second-best performing position amongst mid-cap positions, up 54.1%. VMI is in the metal fabrication industry but sells its products across numerous sectors. A massive federal infrastructure spending bill would likely be a direct benefit however, VMI’s success is not linked entirely to whether one is passed. VMI is on Hold.
In advance of the upcoming “Worst Four Months,” all defensive positions (shaded in grey in table below) can be considered on dips or at current levels. Suggested buy limits are included. Abbott Labs (ABT), AT&T (T) and Verizon (VZ) can be considered at current levels up to their respective buy limits. Other defensive positions, AEE, BIP, DTE, DUK, EXC and SO can be considered on dips.
Please see table below for specific stop losses and current advice for each position in the portfolio. All positions not previously mentioned are on Hold.
|
ETF Trades & NASDAQ’s Best Eight Months: Technology Shares Stall
|
|
By:
Christopher Mistal
|
June 03, 2021
|
|
|
|
NASDAQ’s Best Eight Months Update
As the number of vaccines administered has continually climbed and COVID-19 cases have fallen, traders and investors have shifted from stay-at-home stocks to reopening stocks. As a result, technology shares have taken a breather this year. Even though they have eased from previous highs, the Invescos QQQ (QQQ) position held in the Tactical Seasonal Switching Strategy was still up 14.0% as of yesterday’s close since last November.
In the chart above, NASDAQ’s essentially sideways trading since February is clearly visible in the upper pane. In the lower pane the current status of our Seasonal MACD Sell indicator remains positive but is slowly fading. As of today’s close, it would take a one-day loss of 348.15 NASDAQ points (2.56%) to turn MACD negative.
When NASDAQ’s MACD Sell indicator turns negative again, we will issue our NASDAQ Seasonal MACD Sell signal and begin clearing out remaining technology and/or small-cap positions held in the Almanac Investor ETF Portfolios. Until that time, all related positions are on Hold.
June Sector Seasonalities
There is only one new Sector Seasonality that begins in June, a bearish period for natural gas stocks that is based upon the NYSE ARCA Natural Gas index (XNG). We are going to pass on this trade setup. XNG has been rallying since last October with only the briefest of pauses along the way. Expanding energy demand mainly due to the reopening economy has been driving energy costs higher and in turn the stocks that constitute XNG higher.
Natural gas and crude oil both plummeted last year and their rebounds only appear to be gathering momentum with the new administration taking action to reduce carbon emissions over the long term by terminating leases and pipeline projects. The market appears to be factoring in increasing demand along with the potential for reduced supply in the not-too-distant future which is not the ideal setup to short a sector.
Sector Rotation ETF Portfolio Updates
Three bullish and one bearish Sector seasonalities come to an end in June. Starting at the top of the table on the bottom of page 92 in the 2021 Stock Trader’s Almanac, the bullish trade based upon XNG comes first. Our correlating ETF position, first presented in January, First Trust Natural Gas (FCG), traded above its auto-sell in February and was closed out for a relatively quick 25.2% gain excluding any trading costs or dividends.
The next seasonality to end is a bearish period for gold and silver stocks based upon the Gold and Silver index (XAU). We passed on this setup earlier as inflation concerns muddled the fundamental outlook and the technical setup appeared less than ideal. This decision proved prudent as XAU rallied along with gold and silver during this time. Positions in SPDR Gold (GLD) and iShares Silver (SLV) have advanced since last update and are on Hold.
Lastly, we come to the Consumer sector, Discretionary and Staples. SPDR Consumer Discretionary (XLY) was up 12.8% at yesterday’s close and is on Hold. We will close out XLY when we issue NASDAQ’s Seasonal MACD Sell signal. In the meantime, XLY’s stop loss has been raised to a relatively tight $168.28. SPDR Consumer Staples (XLP) however, can be considered on dips below a buy limit of $69.70. Staples has a solid historical record of weathering the “Worst Six Months” well with a combination of a high frequency of gains and average performance even before considering any dividends paid.
iShares DJ US Tech (IYW) is on Hold. This position will be closed out when we issue NASDAQ’s Seasonal Sell. IYW’s stop loss has been raised to a snug $90.62.
In addition to XLP, SPDR Healthcare (XLV), iShares NASDAQ Biotech (IBB) and SPDR Utilities (XLU) can all be considered on dips below their respective buy limits. Similar to consumer staples, these sectors have a solid historical tendency to hold up and/or outperform during the Worst Months.
Wrapping up the Sector Rotation portfolio are Global X Copper Miners (COPX) and United States Copper (CPER). COPX and CPER are on Hold. Stop losses have been raised as copper has historically reached a peak in May and/or early-June.
Tactical Seasonal Switching Strategy Updates
We will continue to maintain a neutral bias in the Tactical Seasonal Switching portfolio until NASDAQ’s Seasonal MACD Sell triggers. At that time the portfolio will shift to a conversative stance for the balance of the Worst Months. Barring another sizable sell off, the odds of another blowout Worst Months like last year are historically not great compared to the likelihood of the more typical sideways and volatile trading.
Bond positions, AGG and BND can still be considered on dips below their respective buy limits. Invescos QQQ (QQQ) is on Hold. Disappointingly, iShares Russell 2000 (IWM) was stopped out on May 12 when it closed below $212.00. Nonetheless, IWM was still up nearly 29% since last November.