|
Market at a Glance - 6/29/2023
|
|
By:
Christopher Mistal
|
June 29, 2023
|
|
|
|
Please take a moment and register for our member’s only webinar, July 2023 Outlook and Update on Wednesday July 5, 2023, at 2:00 PM EDT here:
Please join us for an Almanac Investor Member’s Only discussion of recent market action and NASDAQ's Seasonal MACD Sell with time for Q & A at the end. Jeff and Chris will cover their outlook for July, review the Tactical Seasonal Switching Strategy ETF, Sector Rotation ETF, and Stock Portfolio holdings and trades. We will also share our assessments of the Fed, inflation, recession prospects, the "Worst Months" as well as relevant updates to seasonals now in play.
If you are unable to attend the live event, please still register. Within a day of completion, we will send out an email with links to access the recording and the slides to everyone that registers.
After registering, you will receive a confirmation email containing information about joining the webinar and a reminder message.
Market at a Glance
6/29/2023: Dow 34122.42 | S&P 4396.44 | NASDAQ 13591.33 | Russell 2K 1881.59 | NYSE 15737.38 | Value Line Arith 9317.74
Seasonal: Bearish. July is the first month of NASDAQ’s “Worst Four Months.” It is also the third month of DJIA’s and S&P 500’s “Worst Six Months.” Although July is the best month of Q3, it has historically been weaker in pre-election years. First half of July historically stronger than second. Summer volume doldrums often commence with Independence Day celebrations.
Fundamental: Murky. Although Q1 GDP was revised higher to 2% earlier today it is still softer than the 2.6% pace recorded in the previous quarter. The trend of slowing growth is also reflected in Q2 projections. Atlanta Fed’s GDPNow model is currently at 1.8% for Q2 as of its most recent June 27 update. Inflation metrics are cooling but remain elevated increasing the odds of additional interest rate increases. Corporate earnings are a mixed bag. One silver lining, according to official metrics, is the labor market. Unemployment was 3.7% with 339,000 net new jobs added in May.
Technical: Consolidating. After breaking out to new 2023 highs in June, DJIA, S&P 500 and NASDAQ all retreated modestly. NASDAQ’s mid-year rally officially kicked off earlier this week and historically runs until around the ninth trading day of July (7/14 this year). When the mid-year rally fizzles out, more choppiness is likely.
Monetary: 5.00 – 5.25%. The Fed did pause in June, but it then proceeded to signal it is not likely done increasing rates. With year-over-year CPI, PPI and PCE below Fed funds rate, monetary policy appears restrictive now, but the full impact of the quickest rate increases in decades is still unclear. If the Fed wasn’t fighting substantial federal government spending, its goal of achieving a 2% inflation rate would likely be accomplished much sooner.
Sentiment: Retreating. According to Investor’s Intelligence Advisors Sentiment survey Bullish advisors stand at 50.0%. Correction advisors are at 31.4% while Bearish advisors numbered 18.6% as of their June 28 release. Bullish advisors peaked shortly after the market did around mid-June at 54.3%. However, they did not switch to bears. Instead, Correction advisors expanded. It would seem our seasonal research is gaining traction with more advisors as we also see little more than a mild correction during the “Worst Months.”
|
July Outlook: Mid-Summer Peak Coming, Summer Doldrums Ahead
|
|
By:
Jeffrey A. Hirsch & Christopher Mistal
|
June 29, 2023
|
|
|
|
Jeff is reporting from Vermont. After his oldest son turned 18 and graduated high school, he dropped the younger guy off at Dartmouth rugby camp and headed across the Connecticut River past where the pavement ends in Sharon VT to a mod little house in the woods. Hiking the soaked forest trails of the Upper Valley along the rushing swollen streams provides a fresh perspective to reflect on our second half outlook.
It’s been a big week for the market and the world with the Russian rebellion sending the geopolitical pundits into a tizzy about the status of Putin’s reign and the war in Ukraine. It remains to be seen what happens with Prigozhin, Russia and Putin, and how it may impact the Russia-Ukraine War, if at all.
We kicked around an interesting internal theory we have not heard elsewhere that perhaps Prigozhin and the fleeting weekend revolt can serve as a scapegoat for Putin and Russia and can be used as cover and a face-saving excuse for an easy exit strategy out of Ukraine. However, it seems far more likely to us that the weekend’s events will only further solidify Putin’s power and harden his will and determination to continue fighting for outright victory. For now, the conflict and the uncertainty it creates persists.
At the midpoint of the year NASDAQ continues rushing like a rain-swollen summer stream. But the tech-laden index, as well as the rest of the market, are poised to roll down the other side of the mid-July peak into the market’s summer volume doldrums and the worst two months of the year August/September.
Our updated NASDAQ seasonal chart below comparing all years to pre-election years and our STA Aggregate cycle, which combines all years, the election cycle (pre-election years) and decennial cycle (third years) depicts how the market continues to closely track historical and seasonal patterns. So far in 2023 NASDAQ is following the trend of the pre-election pattern, but is way ahead, up 29.9% year-to-date!
As you know, June is the last month of NASDAQ’s Best 8 Months. But in case you missed it we issued our NASDAQ Best 8 Months MACD Seasonal Sell Signal on June 23. The sell signal appears to be rather timely this year. We may get a bit more upside as NASDAQ’s 12-day midyear rally from the last three days of June to the 9th trading day of July can carry stocks higher into July. Use any near-term upside to reposition for the Worst 4 Months July-October.
The three seasonal patterns below all show the likely path of the market is sideways over the next four months with a lot of chop and flop. We don’t expect much more than a few 5-10% pullbacks. As traders begin to take time off to enjoy the summer and congress goes into recess for the month of August, market trading volume tends to diminish into what we call the summer doldrums where stock prices drift, bobbing up and down until and unless some news event moves them one way or another. Then as the end of Q3 nears, institutional fund managers partake in their annual performance dance, restructuring portfolios and doing a little window dressing, which often results in a correction in August and/or September.
![[NASDAQ Pre-Election Year Seasonal Chart]](/UploadedImage/AIN_0723_20230629_NASDAQ_Seasonal_Pre-Election_STAAC_900.jpg)
The good news is that the “Sweet Spot” of the 4-Year Cycle has delivered. Gains over the best three quarters of the 4-Year Cycle from Q4 midterm year through Q2 pre-election year have been right in line with the historical averages. As of today’s close, Sweet Spot gains are 18.8% for DJIA, 22.6% for S&P and 28.5% for NASDAQ vs. 19.3%, 20.0% and 29.3% respectively on average from 1949-2022.
We just finished the 2024 Stock Trader’s Almanac page proofs, which will be off the press early this fall, and after 58 years of looking ahead 6-18 months for next year’s outlook, the strength of the 4-year cycle is clear and present. It is especially so this cycle as we have tracked the historical trend so closely. Here’s a sneak peek at the new edition. Many of you will recognize this chart – or a version of it.
Looking ahead to election year 2024 we are reminded of the power a sitting president running for reelection holds over the market. When a sitting president is running for reelection S&P 500 averages a gain 12.8% in election years since 1949. This is substantially better than when there is an open field with no sitting president in office running, culminating in a loss of -1.5% on average for the year. The market hates uncertainty and with a sitting president running there is a good chance market, economic and civic conditions will likely remain unchanged whereas with an open field there are a great deal of unknowns. 2024 has that power of incumbency going for it.
![[4-year cycle Line Chart]](/UploadedImage/AIN_0723_20230629_4-Year_Cycle_2023_Chart_900.jpg)
Analysis from other non-seasonal indicators supports our view that the market is likely to go nowhere for the next few months. Q1 GDP was revised higher, but at 2% it’s not blowing anybody away. Recession hawks out there remain vigilant, but with the economy and market plugging along we still don’t see it. Inflation continues to trend lower, yet it remains elevated. The Fed paused, but they remain hawkish and continue to threaten another ¼ point hike or two.
Blue chips rallied today on the major banks passing the stress test and Q1 GDP being revised upward. Small caps are finally participating in the rally, but have historically peaked versus large-caps in late-May to early June and tend to begin underperforming in July until sometime in the fourth quarter. NASDAQ and big tech appear to be on the ropes and running out of gas. Recent high bullish sentiment appears to have peaked and is heading lower ahead of the market’s weakest seasonal period.
Considering we have enjoyed this bull market rally since our Best Months Seasonal MACD Buy Signal back in October, sticking to the system, being patient and not chasing this rally remains the most prudent course of action. Fundamentals, technical analysis, sentiment, monetary policy and geopolitics tend to confirm our cautious stance for the next few months, while still anticipating new highs later this year and next.
So, enjoy your summer while collecting all those nice money market fund and bond interest payments we have not had for years, while we await the fatter pitch in the fall and the likely pre-election year Q4 rally to new recovery highs if not all-time. Wishing you all a happy summer on the sidelines. Enjoy!
Pulse of the Market
In stark contrast to NASDAQ, it has been a challenging year for DJIA as we near the end of the first half of 2023. As of today’s close (June 29), DJIA is up a mere 2.9% year-to-date. All of this meager gain and then some has been in June (+3.7%). DJIA’s meandering 2023 performance has kept it trapped in a narrow range between 32000 and 34500 (1). After a brief reversal in early June, both MACD indicators applied to DJIA are negative again (2) confirming its recent failed break out attempt and loss of momentum.
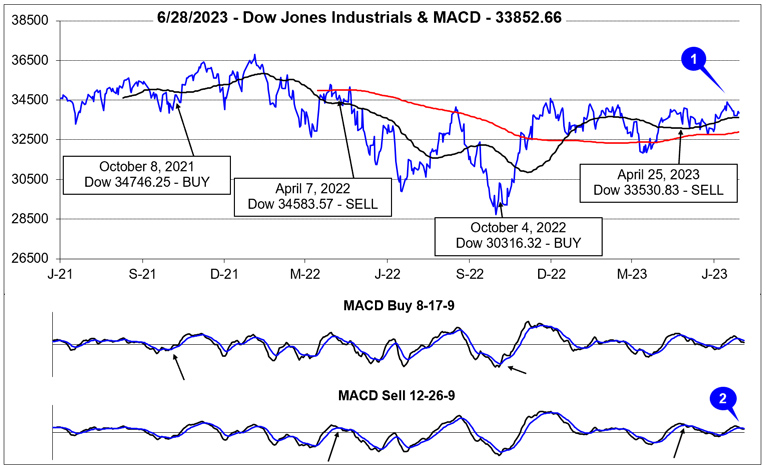
Following a nine straight week stretch free of any Down Friday/Down Monday (DF/DM) occurrences, DJIA has recorded three in the last six weeks and two back-to-back (3). Historically DF/DM occurrences have been around significant market inflection points that have frequently seen reversals in the prevailing trend at the time. The two most recent DF/DM’s have come at what is increasingly looking like the end of the spring rally. If DJIA fails to return to its highs of the year in timely manner, more weakness is likely especially after NASDAQ’s mid-year rally comes to an end.
With NASDAQ’s Best Months including May and June, it has enjoyed the best performance since the end of April (5). Until last week, NASDAQ had been up eight weeks straight. Tech-heavy S&P 500 also benefited, advancing in six (4) of the eight weeks that NASDAQ was up. As previously noted, DJIA has been the weakest this year and logged only five modest weekly gains during the same 8-week period. More choppy trading across all indexes is likely are some first half of July strength.
Market breadth had been making improvements in June up until around mid-month. Last week’s declines (during the historically weak week after June monthly and quarterly options expiration week) saw Weekly Advancers retreat to their lowest levels mid-March as decliners outnumbered advances (6) by over 2 to 1. Should the market find its footing look for a corresponding increase in Weekly Advancers.
Even though DJIA, S&P 500 and NASDAQ broke out to new 2023 highs in June, Weekly New Highs (7) did not. The peak in New Weekly Highs was 356 during the week ending February 3. Similarly, New Weekly Lows also failed to slip below earlier year minimum readings. This suggests leadership is growing increasingly thin which could result in a more meaningful pullback in the near term.
Since the start of June, the 90-day Treasury rate and the 30-year Treasury rate have declined modestly (8). Part of the decline could be the Fed’s pause and the other part could be the very early stages of the next rotation out of stocks in the advance of the “Worst Four Months.” Nonetheless, the Fed is signaling more increases are highly likely while the 90-day Treasury still has the highest yield since January 2001.
|
NASDAQ Seasonal MACD Update: Rally Fizzles
|
|
By:
Christopher Mistal & Jeffrey A. Hirsch
|
June 23, 2023
|
|
|
|
As of today’s close, the slower moving MACD “Sell” indicator applied to NASDAQ is negative. NASDAQ’s “Best Eight Months” has come to an end. At this time we are issuing our Seasonal MACD Sell signal for NASDAQ.
Sell Invesco QQQ (QQQ).
Sell iShares Russell 2000 (IWM).
For tracking purposes, these positions will be closed out of the Tactical Switching Strategy ETF Portfolio using their respective average prices on Monday, June 26.
From our seasonal buy signal last fall, NASDAQ advanced 20.7% as of today’s close. QQQ, which tracks the NASDAQ 100, jumped an impressive 29.7%. Recent weakness appears to have been triggered by the Fed. They did pause at the last meeting, but also just stopped short of promising at least another two 0.25% rate increases. Given the data-driven nature of the Fed and the continued choppiness in economic reports, it would not be surprising to see the market slip into another choppy sideways trading range like what the market was doing before the current rally began.
Uncertainty is on the rise once again just as the historically weak summer months arrive. The risk of potentially more interest rate increases also dampens our summertime outlook for longer-dated bond ETFs. Existing positions in TLT, AGG and BND on are Hold. Cash, money market, and/or short-duration bond ETFs like SHV and SGOV are likely to be the least risky during the “Worst Months” this year. SHV and SGOV can be considered at current levels.
|
NASDAQ Seasonal MACD Update: Rebound Holds
|
|
By:
Christopher Mistal
|
June 22, 2023
|
|
|
|
By the thinnest of margins, today’s NASDAQ rally kept our Seasonal MACD indicator positive following three straight days of declines. Based upon today’s close, NASDAQ will need to gain at least 123.46 points (0.91%) tomorrow, June 23, to keep its Seasonal MACD indicator positive another day.
Continue to hold associated positions in QQQ and IWM. When NASDAQ’s Seasonal MACD turns negative we will send an email to all active members. At that time, we will finish repositioning our Portfolios for the “Worst Months.”
|
July Almanac & Vital Stats: Softer in Pre-Election Years
|
|
By:
Jeffrey A. Hirsch & Christopher Mistal
|
June 22, 2023
|
|
|
|
July historically is the best performing month of the third quarter however, the mostly negative results in August and September tend to make the comparison easy. “Hot” Julys in 2009 and 2010 where DJIA and S&P 500 both gained greater than 6% combined with strong performances in 2013, 2018, and 2022 have boosted July’s average gains since 1950 to 1.3% and 1.3% respectively. Such strength inevitability stirs talk of a “summer rally”, but beware the hype, as it has historically been the weakest rally of all seasons (page 74, Stock Trader’s Almanac 2023).
July begins NASDAQ’s worst four months and is the sixth weakest performing NASDAQ month since 1971, posting a 0.8% average gain. Dynamic trading often accompanies the first full month of summer as the beginning of the second half of the year brings an inflow of new capital. This creates a bullish beginning, middle, a mixed week after monthly options expiration and some strength towards the end. However, the last trading day of July has had a bearish bias over the last 21 years. In pre-election years since 1950, early strength has tended to fade around mid-month.
![[Recent 21-Year July Market Performance (2001-2021) Seasonal Pattern Chart]](/UploadedImage/AIN_0723_20230622_July_Seasonal_Chart.jpg)
July’s first trading day is the third best performing first trading day of all twelve months with DJIA gaining a cumulative 1668.15 points since 1998. Over the past 21 years, DJIA’s first trading day of July has produced gains 76.2% of the time with an average advance of 0.31%. S&P 500 has advanced 85.7% of the time (average gain 0.35%). NASDAQ has been similarly bullish advancing 81.0% of the time (0.31% average gain). No other day of the year exhibits this amount of across-the-board strength which makes a case for declaring the first trading day of July the most consistently bullish day of the year over the past 21 years.
Trading on the day before and after the Independence Day holiday is often lackluster. Volume tends to decline on either side of the holiday as vacations begin early and/or finish late. Since 1980, DJIA, S&P 500, NASDAQ and Russell 2000 have recorded net losses on the day after.
Pre-election-year July rankings are something of a mixed bag, ranking #7 for DJIA and S&P 500, averaging gains of 1.0% and 0.9% respectively (since 1950); while NASDAQ (since 1971) and Russell 1000 (since 1979) pre-election Julys both rank #9. NASDAQ has advanced in seven of the last thirteen pre-election Julys. Russell 2000 has advanced in five of its last ten. Despite tech’s and small-cap’s meager pre-election July track record, NASDAQ and Russell 2000 have averaged gains of 1.0% and 0.3% respectively.
NASDAQ’s 12-Day Midyear Rally
In the mid-1980s tech’s influence in the market began to grow and the market’s focus in early summer shifted to the outlook for second quarter earnings of technology companies. In anticipation of positive results, over the last three trading days of June and the first nine trading days in July, NASDAQ typically enjoys a rally. This 12-day run has been up 29 of the past 38 years with an average historical gain of 2.4%. Look for this rally to begin around June 28 and run until about July 14.
After the bursting of the tech bubble in 2000, NASDAQ’s mid-year rally had a spotty track record from 2002 until 2009 with three appearances and five no-shows in those years. However, it has been quite solid over the last thirteen years, up eleven times with two losses. Last year, NASDAQ faltered during the 12-day span, but eventually took off in the second half of July, up 12.3%.
|
July 2023 Strategy Calendar
|
|
By:
Christopher Mistal
|
June 22, 2023
|
|
|
|
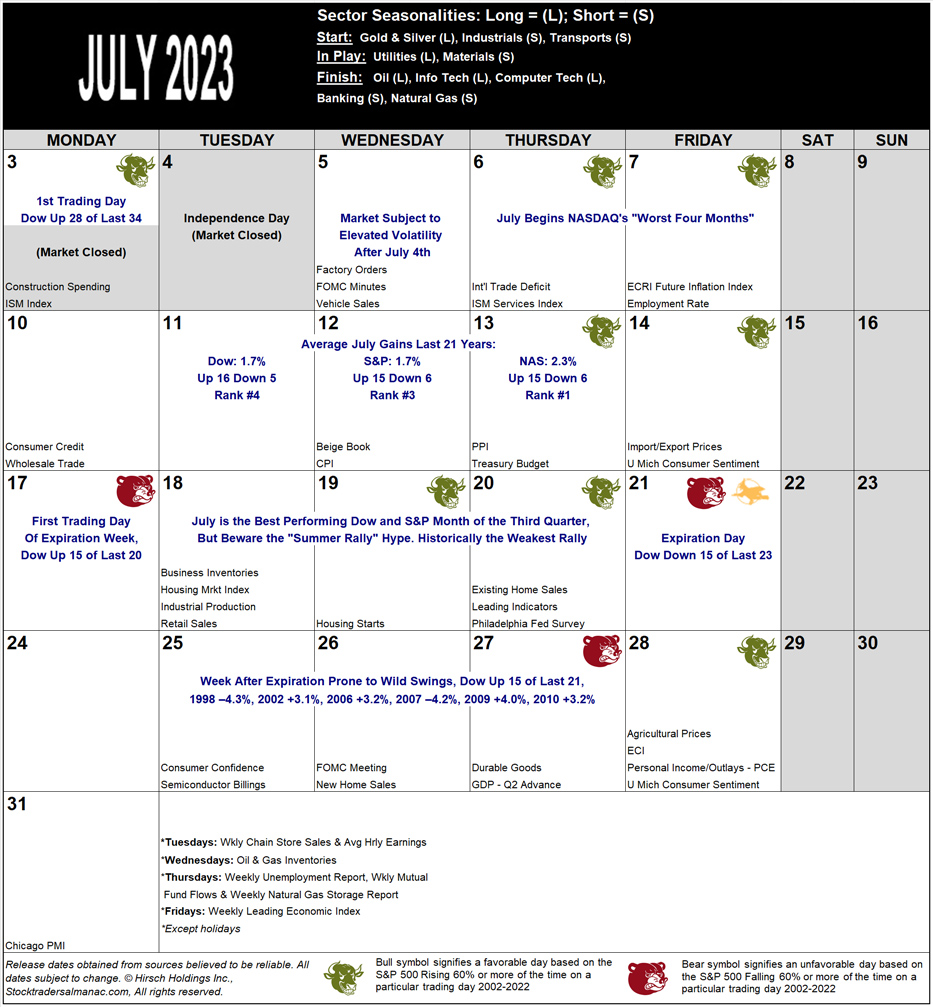
July 2023 Strategy Calendar Note: This year the first trading day of month is July 3. As a result, the Monday of monthly options expiration week is also the tenth trading day of the month. Historically, the first trading day of July monthly options expiration week has been bullish with the Dow up 15 of the last 20. However, the tenth trading day of July has been bearish over the last 21 years. It is also important to note that the Bullish and Bearish days on the calendar are based upon the S&P 500. It is entirely possible that the day could be positive for Dow and negative for S&P 500.
Click here to download printer friendly pdf file of July 2023 Strategy Calendar...
|
NASDAQ MACD & Market Updates: Beware the Summer Rally Hype
|
|
By:
Christopher Mistal
|
June 15, 2023
|
|
|
|
NASDAQ’s spring rally continues. S&P 500 has also broken through resistance and currently trades above its highs from last August largely due to the sizable tech weighting. DJIA and Russell 2000 are also participating in the rally but have not yet broken out. DJIA has eclipsed its high from last August but has yet to exceed its November 30 closing high while Russell 2000 is still far below its February closing high. It would seem the fear of missing out trade has taken over and will likely run a bit longer.
![[NASDAQ Daily Bar Chart with MACD]](/UploadedImage/AIN_0723_20230615_NASDAQ.jpg)
Improving momentum has kept NASDAQ’s Seasonal MACD indicator positive and its trend is also now positive (blue line expanding away from red line in MACD pane of chart above). As of today’s close, it would take a single-day decline of 700.38 points (5.08%) to turn MACD negative. Continue to hold associated positions in QQQ and IWM. When NASDAQ’s Seasonal MACD turns negative we will send an email to all active members. At that time, we will finish repositioning our Portfolios for the “Worst Months.”
Bubbly Sentiment Drives Summer Rally Hype
NASDAQ’s charge higher and S&P 500’s break out have turned sentiment bullish. According to
Investor’s Intelligence latest Sentiment survey as of June 13, bullish advisors reached 53.4%, bearish advisors have slipped back to 20.6% and correction advisors are at 26.0%. This is only the third week of 2023 with bullish advisors above 50%. This is also the most bulls since November 2021. The current level of bulls suggests that limited capital may remain on the sidelines to drive the market higher. Yet another sign of growing trader and investor complacency is the CBOE VIX index declining to its lowest levels since January/February 2020.
Such an improvement in sentiment will likely trigger earlier than usual talk of the perennial summer rally. On page 74 of the 2023 Almanac the DJIA’s seasonal rallies are presented. Historically, the summer rally has been the weakest of the four seasons for DJIA. With NASDAQ clearly providing leadership to the market we present NASDAQ’s Seasonal rallies below since 1971.
![[Seasonal Gains By NASDAQ Table]](/UploadedImage/AIN_0723_20230615_Seasonal_Rallies_Table.jpg)
Using the same definitions for the starting and ending point of each season’s rally as used in the annual Almanac, the market is officially still in its spring rally as Q2 has not yet ended. NASDAQ’s seasonal rally performance does not differ all that much from DJIA. Historical performance for spring and fall rallies are relatively close for both NASDAQ and DJIA. Winter is best for both while summer is also weakest for both. Even NASDAQ’s best summer rally of 40.3% in 1980 is dwarfed by its 70.1% winter rally in 2000. It would seem the same warning that applies to DJIA also applies to NASDAQ, “beware the summer rally hype.” This was certainly on point last year when the market’s summer rally abruptly ended in August.
As of today’s close, NASDAQ’s spring rally stands at 23.7%. This is comfortably above the historic average of 15.0%, but still less than half of the best spring rally of 47.7% in 2020. Using NASDAQ’s May 4, 2023, closing low through today’s close, NASDAQ’s summer rally potentially stands at 15.2% which is slightly above historical average. We will wait for our NASDAQ Seasonal MACD sell signal to tell us when the current rally has run its course.
With the end of June quickly approaching, it is also time to be on the lookout for the market’s volume doldrums (page 48 STA 2023). Historically, trading activity and volume has tended to begin to fade near the end of June or the beginning of July. As of the close on June 14, NASDAQ and NYSE volume has been trending higher along with the major indexes. Should volume begin to decline, the indexes could do the same.
Despite the pause in interest rate hikes yesterday, inflation and the Fed remain headwinds to the market. After yesterday's announcement and press conference, interest rate expectations are still in flux. The Fed’s mixed signals of pausing now and threatening more hikes down the road tells me their crystal ball is no better than anyone else’s. A data-driven approach makes perfect sense but why not just come out and say as much.
![[Fred CPI, PPI, & PCE Chart]](/UploadedImage/AIN_0723_20230615_Inflation_Fred_Chart.jpg)
Recent declines in inflation metrics are encouraging and potentially concerning at the same time. One of the Fed’s preferred metrics, Personal Consumption Expenditures (PCE) did tick higher in April. CPI and PPI readings in May did move lower so May PCE should make a similar move lower. If it does not, then the Fed’s recent hawkish remarks and interest rate forecasts would likely become more meaningful. The Fed may also be realizing that it is not only fighting the inflation from record liquidity and federal spending during Covid, but also the continued substantial amounts of federal spending authorized by the CHIPS and Science Act, the Infrastructure Investment and Jobs Act, and the Inflation Reduction Act.
In addition to typical seasonal weakness during the Worst Months, the market could have to contend with interest rates going still higher and remaining higher for longer than expected. We expect the current tech-driven rally to persist for the next several weeks but remain cautious as NASDAQ’s “Best Eight Months” near its end and bullish sentiment is nearing frothy levels.
|
NASDAQ MACD & Stock Portfolio Updates: Tech Rally Slowing
|
|
By:
Christopher Mistal
|
June 08, 2023
|
|
|
|
NASDAQ’s rapid ascent that began in May is beginning to show signs of weakening. NASDAQ did manage to breakout above its highs of last August, but the breakout has not triggered a flood of new capital in fear of missing out. We suspect we are not the only ones looking for a similar breakout from DJIA and S&P 500. DJIA has moved closer to its closing high on November 30, 2022, but remains below it. S&P 500 is currently struggling to overcome and breakout above 4300, its peak last August.
Despite the slowing of NASDAQ’s momentum recently, MACD is still positive. As of today’s close it would take a single-day decline of 328.66 points (2.48%) to turn MACD negative. Continue to hold associated positions in QQQ and IWM. When NASDAQ’s Seasonal MACD turns negative we will send an email to all active members. At that time, we will finish repositioning our Portfolios for the “Worst Months.”
Quick Q & A
Recently we have had several inquires about the parameters we use for our Seasonal MACD Sell Signal for NASDAQ as well as why we are also holding iShares Russell 2000 (IWM). As a reminder we use the common 12-26-9 MACD parameters for our seasonal sell signals, including NASDAQ. The short interval is 12, the long interval is 26 and 9 is the interval used on the difference between the short and long intervals. Our seasonal sell signals are based upon daily closing prices only. In the above chart of NASDAQ and MACD, C equals closing price, 12 and 26 are the short and long intervals. F is a software setting and stands for false.
We had previously attempted to explain why we hold IWM with QQQ in the member’s only webinar on May 31. (The recording and slides are available
here (or copy and paste in a new browser window:
https://www.stocktradersalmanac.com/LandingPages/webinar-archive.aspx). The bar chart below is the clearest reason why we are holding and why we also trade IWM with QQQ for NASDAQ’s “Best Eight Months.” Using NASDAQ data since inception in 1971 and Russell 2000 data since inception in 1979, average monthly performance for the two indexes has historically been similar. Russell 2000’s laggard performance this Best Months period is not typical. We suspect the nearly 8% gain by IWM so far this month will dampen some concerns over its laggard performance.
![[NASDAQ and Russell 2000 Monthly Performance Bar Chart]](/UploadedImage/AIN_0723_20230608_NAS-R2K_Monthly_Avg.jpg)
![[Russell 2000 Daily Bar chart with MACD]](/UploadedImage/AIN_0723_20230608_Russell2K.jpg)
Applying our Seasonal MACD Sell indicator to Russell 2000 we see it is also positive and trending higher as of today’s close. Research is underway to validate any benefits of adding a Russell 2000 MACD Sell Signal and incorporating it into the Tactical Switching Strategy. Provided the data demonstrates improved performance and/or improved risk management, we would likely be ready later this year when the next Best Months period begins sometime on or after October 2, 2023 (the first trading day of the month this year).
Stock Portfolio Updates
Over the last four weeks since the last update through yesterday’s close (June 7), S&P 500 advanced 3.1% while Russell 2000 jumped 7.3%. Over the same period the entire portfolio climbed 4.6% higher, excluding dividends and any trading fees. Mid-cap positions contributed the most, up 53.4% while small caps and large-caps advanced 3.1% and 1.1% respectively.
The brightest stocks in the portfolio are connected to the AI market. Super Micro Computer (SMCI) was the first to trade at twice its original price on May 18. Axcelis Technologies (ACLS) did the same one week later. Per standard trading guidelines (noted at the bottom of the portfolio table below), half of the original position in both was sold when they first doubled. As of yesterday’s close, adjusted for selling half, ACLS was up 111.9% and SMCI was up 146.3% since November 10, 2022. Both stocks advanced today adding to these gains. ACLS and SMCI are on Hold. Suggested stop losses have been updated to reflect recent gains.
Permian Resources (PR), the other mid-cap holding was stopped out of the portfolio on May 11 when it closed below $9.35. PR did rebound modestly since then, but the uncertainty and volatility in the energy sector makes holding PR unpalatable.
Large-cap healthcare stocks, Elevance Health (ELV) and UnitedHealth Group (UNH) can still be considered. Historically, during the Worst Months, healthcare has been third best by average performance and its frequency of gains at 69.7% is in a three-way tie for third best. ELV can be considered on dips below $450 while UNH can be considered at current levels up to a buy limit of $485.
AT&T (T) remains a drag on the large-cap portfolio. It was originally added for its hefty dividend. Its dividend remains attractive, but interest rates have risen giving investors potentially less risky alternates. There are some positives. T did get an analyst upgrade this week, to market perform from underweight. It also appears that competition between rivals is easing. But the possibility of Amazon offering a low-cost or even free mobile service to its Prime members has offset the positives. T is on Hold.
All positions not previously mentioned are on Hold. DJIA and S&P 500 Worst Months are here. We are officially neutral on the market and transitioning to a more cautious stance in the portfolios. When NASDAQ’s Seasonal Sell signal triggers, we will consider additional defensive measures. In the meantime, the market’s narrow advancing breadth has resulted in the stock portfolio being trimmed back to just 10 positions and a sizable cash balance that is nearly 74%. This would be an easily managed portfolio for the summer months if that is your plan. Plus, with interest rates at their highest levels in nearly two decades, the cash could earn a reasonable return.
|
ETF Portfolios & NASDAQ Seasonal MACD Update: Continue to Hold
|
|
By:
Christopher Mistal
|
June 01, 2023
|
|
|
|
In case you missed the member’s only webinar on Wednesday, the slides and video recording are available
here (or copy and paste in a new browser window:
https://www.stocktradersalmanac.com/LandingPages/webinar-archive.aspx). In the webinar we reviewed key seasonal pattern charts that we have been tracking throughout the year, current GDP and inflation trends, Fed interest rate expectations, why Russell 2000 is paired with NASDAQ in the Tactical Seasonal Switching Strategy portfolio and NASDAQ’s Best Eight Months. Jeff recapped the federal debt ceiling showdown and how we will be withholding celebration until a bill reaches the President’s desk and is signed. Our full-year outlook is unchanged as we still see headwinds in the near term.
NASDAQ Seasonal MACD Update
Today is the day that the window for NASDAQ’s Seasonal MACD Sell signal first opens. June is the final month of NASDAQ’s Best Eight Months. NASDAQ’s Seasonal MACD Sell signal has triggered as early as June 1, and as late as July 27 (in 1977).
More recently NASDAQ strength kept MACD positive until July 14 in 2021. This time around June is starting off strongly, adding to May’s NASDAQ momentum. MACD is positive and trending higher. As of today’s close, it would take a single-day decline exceeding 733.22 NASDAQ points (5.60%) to turn our Seasonal MACD Sell negative.
With MACD positive and trending higher, continue to hold associated positions in QQQ and IWM. When NASDAQ’s Seasonal MACD turns negative we will send an email to all active members. At that time, we will finish repositioning our Portfolios for the “Worst Months.” We will anticipate expanding existing bond ETF and cash holdings.
New June Sector Seasonality
There is only one new Sector Seasonality that begins in June, a bearish period for natural gas stocks that is based upon the NYSE ARCA Natural Gas index (XNG). We are going to pass on this trade setup. Domestic inventories are ample above the 5-year average for this time of the year due to a mild winter and adequate supply which has driven the price of natural gas down to around $2.20 per MMBtu. Natural gas prices could go lower still, but the risk of a spike higher during hurricane season due to supply disruption outweighs any potential reward of a short position.
Sector Rotation ETF Portfolio Updates
Two bullish and two bearish Sector Seasonalities come to an end in June. Starting at the top of the table on the bottom of page 94 in the 2023 Stock Trader’s Almanac, the bullish trade based upon XNG comes first. Our correlating ETF position, first presented in January, First Trust Natural Gas (FCG), is currently in the red after struggling to advance during its historically bullish period. FCG is modestly higher today and this strength appears to be a great opportunity to close out the position. Sell FCG. For tracking purposes, FCG will be closed out of the portfolio using its average price on June 2.
The next seasonality to end is a bearish period for gold and silver stocks based upon the Gold and Silver index (XAU). We passed on trading this seasonality earlier this year as gold and silver were rallying in advance of the federal debt limit showdown and likely in anticipation of the Fed pausing interest rate increases. Instead, we looked to trade a breakout of gold last month as it was nearing its all-time highs. A long position in SPDR Gold (GLD) was added to the portfolio on May 16 and is on Hold. iShares Silver (SLV) and Market Vector Gold Miners (GDX) were also added but were quickly stopped out for modest losses. Mixed signals from the Fed on interest rates, varied economic data, and a pending debt limit deal have made the outlook for precious metals and the miners unclear now.
Lastly, bullish seasonalities associated with Consumer Discretionary and Staples come to an end in June. The position in
SPDR Consumer Discretionary (XLY) was stopped out last December.
SPDR Consumer Staples (XLP) could be considered at current levels as the sector has a
solid history of performing during the “Worst Six Months.”
Recent technology sector strength resulted in above average gains and the triggering of two auto-sells in late-May. iShares US Technology (IYW) traded above its auto-sell price of $101.27 on May 26 and was sold for a gain of 34.3% excluding dividends and trading fees. On the following trading day, May 30, SPDR Technology (XLK) traded above its auto-sell price of $166.71 and was also sold for a 36.9% gain. As a reminder, alternate profit taking strategies are acceptable if you continue to hold IYW and/or XLK. One could wait until NASDAQ’s Seasonal MACD Sell signal and/or utilize a tight trailing stop loss.
Positions in sectors that have historically performed well during the “Worst Months,” XBI, IBB, XLP, XLV and XLU can still be considered at current levels or on dips below their respective buy limits.
Tactical Seasonal Switching Strategy Portfolio Update
Continue to Hold QQQ and IWM. NASDAQ’s Seasonal MACD Sell Signal is positive and trending higher. The strategy does not utilize a stop loss on these positions, but should this approach exceed your risk tolerance a trailing stop loss can be considered at this time.
Defensive, partial positions in bond ETFs, TLT, AGG, BND, SHV and SGOV, have retreated slightly as expectations for another Fed interest rate increase have crept higher pushing Treasury bond yields slightly higher and prices lower. Our plan is to add to these positions when NASDAQ’s Seasonal Sell signal triggers, but they can be considered at current levels up to their respective buy limits.
Disclosure note: Officers of Hirsch Holdings Inc hold positions in AGG, BND, FCG, IWM, QQQ, SGOV, SHV, TLT & XBI in personal accounts.