|
August Outlook: Worst Month of the Year and Other Reasons to be Cautious
|
|
By:
Jeffrey A. Hirsch & Christopher Mistal
|
July 30, 2015
|
|
|
|
Our cautious stance over the past several months remains the prudent course of action, or inaction as it were. The broad market has gone virtually nowhere for the past four months and now as the worst two months of the year (August and September) are upon us, market and economic readings are worrisome. Our Best Months Seasonal MACD Sell Signals on April 30 for DJIA and S&P 500, and June 4 for NASDAQ continue to look rather timely.
The major averages are still lagging the historical pre-election patterns and the
DJIA is negative for the year. We have been concerned that this year’s performance is more emblematic of the lower returns associated with the later years of a second-term “lame duck” president rather than the banner third year, or first pre-election year, performance.
Market sentiment has deteriorated with bullish advisors shifting mostly to the correction camp, while bears remain low. Put buying has also picked up over the past month, driving the CBOE Equity Put/Call Ratio to the 0.70 vicinity. Look for more bears than bulls or a near even number of each and more put buying at the end of the next correction. The 5 Down Friday/Down Mondays since the May 19 DJIA high, further highlight the market’s jitters.
While Q1 GDP was revised higher to a fractionally positive number today, Q2 preliminary data was below expectations and Q2 corporate earnings declined verses Q2 last year. Internally, the market is also cracking. Market breadth is rather weak. Declining shares have outnumbered advancing shares and there many more new 52-week lows than new highs. It is becoming increasingly apparent that this bull market is being driven by fewer and fewer participants.
Additional technical concerns can be seen in our latest interpretation of the
Three Peaks and a Domed House Top Pattern we have been tracking. If it plays out, my “count” suggests further downside potential exists. While we are about halfway to the long averted 10% correction we are not expecting a bear market to ensue at this juncture. However, there is no rush to jump back into the equity long side at this time.
The first nine days of August are notoriously weak as are the last few days of the month as summer breaks wind to a close. Mid-month is stronger. After some choppy trading over the next few months and a strong potential for the first 10% correction in the S&P 500 in 4 years, we expect the market to rally to slightly higher highs by yearend and perhaps into Q1 2016 after which we become more concerned for greater downside market action.
Pulse of the Market
DJIA’s most recent all-time closing high was made on May 19, at 18312.39. Since then it has made a series of lower lows and lower highs (1) and has spent an increasing amount of time below its 50-day moving average. During DJIA’s most recent rout, it closed repeatedly below its 200-day moving average and the ensuing rally (Tuesday and Wednesday this week) stalled at the 200-day moving average. DJIA’s 50-day moving average is now declining and after briefly turning positive, DJIA’s MACD indicator (2) is once again negative. With the worst two months of the year, August and September, just around the corner, DJIA’s short-term technical and seasonal outlook is negative.
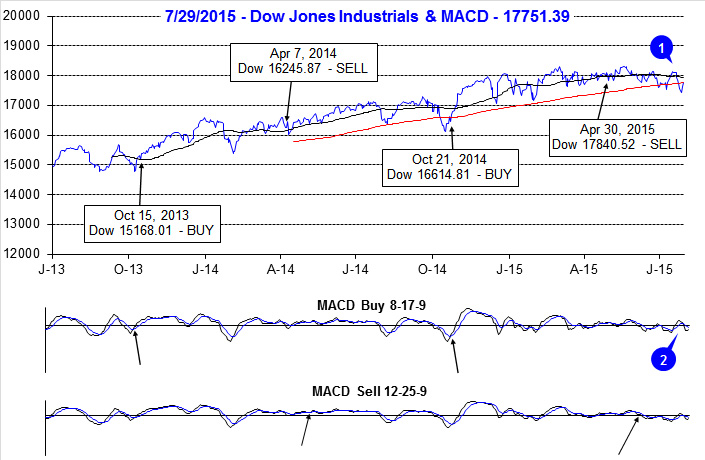
Since DJIA’s May high-close 10 weeks ago, it has registered five Down Friday/Down Monday (DF/DM) warnings (3). Traders and investors reluctant to hold positions over the weekend then failing to buy on Monday is a sign confidence has waned. When confidence begins to disappear, market declines frequently follow. Of 163 DF/DM’s since 1999, DJIA was lower 96.9% of the time sometime during the next 90 calendar days after the DF/DM.
S&P 500 has been down six of the past nine weeks (4) however, down week losses have been mild while up weeks have been stronger. This has helped S&P 500 remain essentially unchanged since the end of May. NASDAQ (5) has been down seven of the last nine weeks, but enjoyed a healthy 4.3% leap higher during mid-July that pushed it to a new all-time high. That was NASDAQ’s best weekly gain in 2015 and its best week since October 24, 2014.
Signs of a divergent and confused overall market continue to be present in the number of NYSE Weekly Advancers and Decliners (6). Flat to negative weeks are accompanied by more decliners than advancers, but in positive weeks, like July 17, advancers just barely outnumber decliners. This is a sign that fewer and fewer stocks are actually contributing to rallies by the major indices. Further compounding the confusion, New 52-Week Lows (7) have outnumbered New Highs in seven of the last eight weeks. New Highs also remain meager. A healthy market advance would have major indices moving higher, together, with notably more Weekly Advancers than Decliners, a more robust number of New Highs and the number of New Lows would be falling.
Weekly CBOE Put/Call Ratio reached its highest level (8) since May/June of 2012 at the start of July. This modest spike higher preceded S&P 500 and NASDAQ early July bottom. Last week’s declines lifted this ratio back to 0.69 which is above neutral, but not high enough to signal or confirm a bottom.
Further confirmation of broad market jitters can be seen in Treasury bond yields and Moody’s AAA rate (9). Both have moved slightly lower in recent weeks even as chatter of a September Fed rate hike has picked up.
Click for larger graphic…
|
Market at a Glance 7/30/2015
|
|
By:
Christopher Mistal
|
July 30, 2015
|
|
|
|
7/29/2015: Dow 17751.39 | S&P 2108.57 | NASDAQ 5111.73 | Russell 2K 1229.60 | NYSE 10883.91 | Value Line Arith 4664.05
Psychological: Nervous. For this first time in months,
Investor’s Intelligence has reported bullish advisors at less than 50% for five straight weeks. Bearish advisors are still the minority as formerly bullish advisors have begun to swell the correction advisors ranks, now at 39.2%. China’s stock market bursting is also a real-time reminder of just how quickly and violently a bear market can be. It has also been nearly four years since the last 10% S&P 500 correction. Add in mixed data, a Fed promising to raise rates and weak seasonal forces and there are plenty of good reasons to be cautious.
Fundamental: Tepid. Although Q1 GDP was revised higher earlier today, Q2 came in below expectations. According to
S&P Capital IQ, corporate earnings declined 0.94% in Q2 compared to year ago. A first blush the labor market appears reasonably healthy with a headline unemployment rate of 5.3% and initial weekly jobless claims are hovering around 40 year lows, but a lot of the improvement in these numbers is due to a substantial shrinking of the labor force. The housing market recently had a few cracks appear, new home sales were a disappointment and inventories of new homes have risen briskly. An interest rate hike could easily cause significant damage to the fragile housing sector recovery.
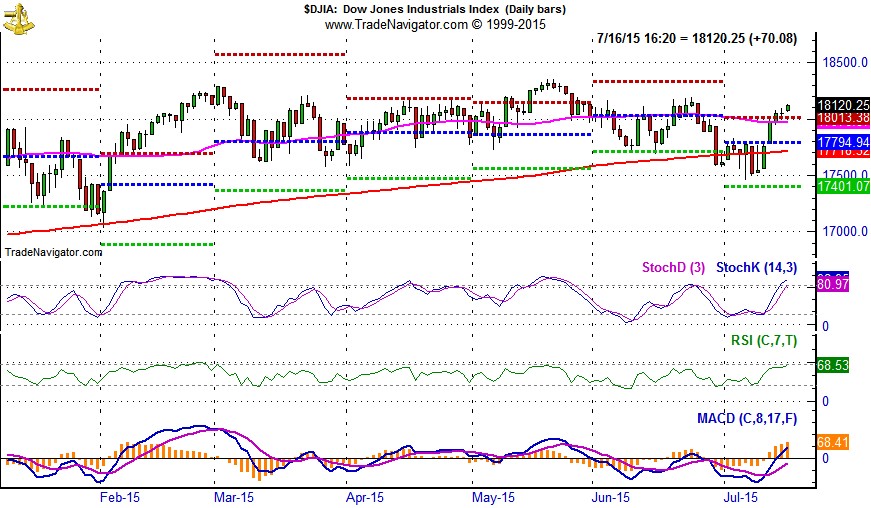
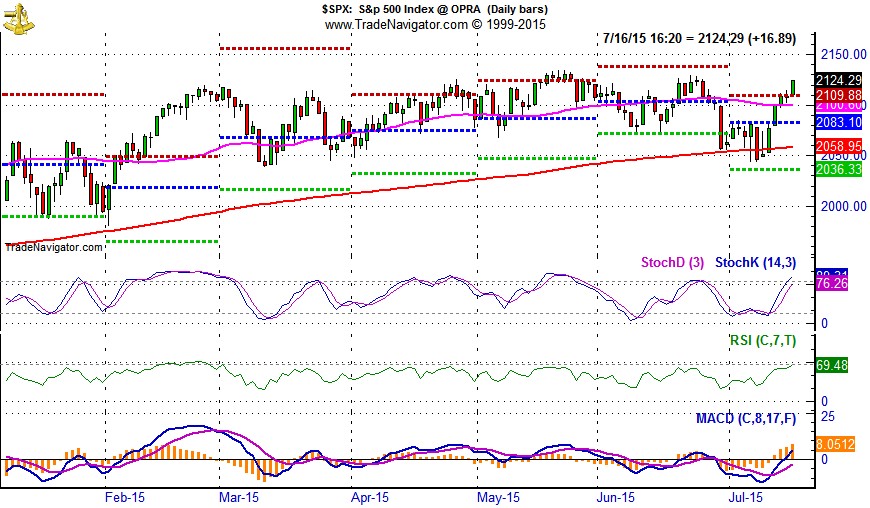
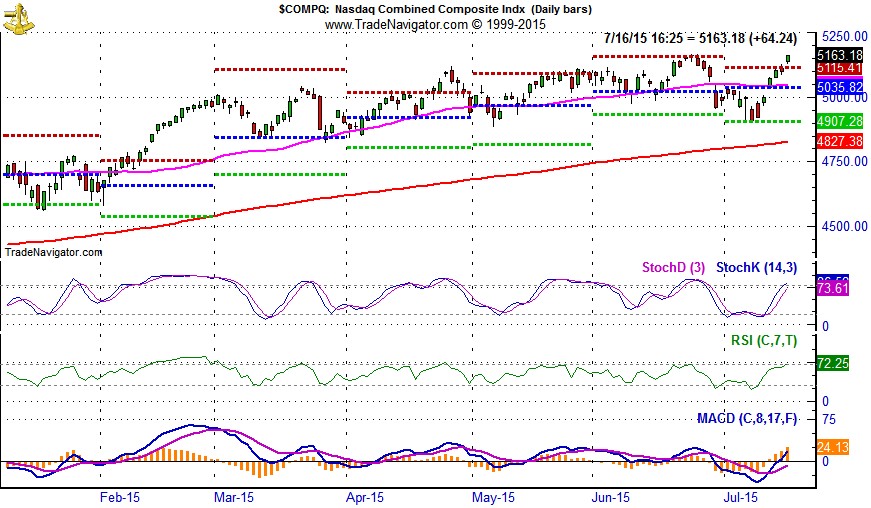
Technical: Range bound. Thanks to a few heavy hitters within the NASDAQ it continues to creep slightly higher and has the healthiest chart. S&P 500 and Russell 2000 have remained range bound. DJIA is the weakest of the lot. Since its last new all-time high in May, DJIA has fallen into a bearish pattern of lower lows and lower highs. If NASDAQ breaks down, DJIA, S&P 500 and Russell 2000 will likely be in real trouble. Current support levels are DJIA 17400, S&P 500 2036, NASDAQ 4900 and Russell 2000 way down near 1150, its January low.
Monetary: 0-0.25%. Even after this week’s FOMC meeting, we are all still left guessing when the first rate hike will take place. Some believe this September, others this December and some not till next year. After today’s GDP report, real money bets, based upon 30-day Fed Funds Futures traded at the CME, are more heavily favoring September. Perhaps, but there are still two months of data between now and then. What’s the first move likely to be? It could be as small as just dropping the current range of 0 to 0.25% and going to a flat 0.25%. It would be a tiny step toward tightening, but at the same time highly unlikely to disrupt much and it would buy the Fed another a month of data. It truly is hard to imagine the Fed being too aggressive with rates especially when they are still rolling over and reinvesting principle and interest payments on their current holdings.
Seasonal: Bearish. August is the worst DJIA and S&P 500 month from 1988-2014 with average declines of 1.1% and 0.8% respectively. It is also the worst month for NASDAQ (–0.1%) and second worst for Russell 2000 (–0.5%) over the same time period. In pre-election years since 1950, Augusts’ rankings improve: #5 DJIA, #6 S&P 500, #8 NASDAQ (since 1971), #8 Russell 1000 and #9 Russell 2000 (since 1979).
|
August Almanac, Vital Stats & Strategy Calendar: Worst Performing Month of Past 27 Years
|
|
By:
By Christopher Mistal & Jeffrey A. Hirsch
|
July 28, 2015
|
|
|
|
Money flows from harvesting made August a great stock market month in the first half of the Twentieth Century. It was the best month from 1901 to 1951. In 1900, 37.5% of the population was farming. Now that less than 2% farm, August is amongst the worst months of the year. It is the worst DJIA and S&P 500 month from 1988-2014 with average declines of 1.1% and 0.8% respectively. August is also the worst month for NASDAQ (–0.1%) and second worst for Russell 2000 (–0.5%) over the same time period. In pre-election years since 1950, Augusts’ rankings improve: #5 DJIA, #6 S&P 500, #8 NASDAQ (since 1971), #8 Russell 1000 and #9 Russell 2000 (since 1979).
Contributing to this poor performance since 1987; the shortest bear market in history (45 days) caused by turmoil in Russia, the Asian currency crisis and the Long-Term Capital Management hedge fund debacle ending August 31, 1998 with the DJIA shedding 6.4% that day. DJIA dropped a record 1344.22 points for the month, off 15.1%—which is the second worst monthly percentage DJIA loss since 1950. Saddam Hussein triggered a 10.0% slide in August 1990. The best DJIA gains occurred in 1982 (11.5%) and 1984 (9.8%) as bear markets ended. Sizeable losses in 2010, 2011 and 2013 of over 4% on DJIA have widened Augusts’ average decline. A strong August in 2014 of S&P 3.8% and NASDAQ 4.8% preceded corrections of 7.4% and 8.4% respectively from mid-September to mid-October.
The first nine trading days of the month have exhibited weakness while mid-month is strongest. Note the bullish cluster from August 14-19. The end of August tends to get whacked as traders evacuate Wall Street for the summer finale. The last five days have suffered in 13 of the last 19 years with the S&P 500 up only four times on the next to last day in the past 19 years. In the last 19 years, the last five days of August have averaged losses of: Dow Jones Industrials, –1.3%; S&P 500, –1.2%; NASDAQ, –0.9% and Russell 2000, –0.3%.
On Monday of expiration the Dow has been up 13 of the last 20 times with four up more than 1%, while on expiration Friday it has dropped in 10 of those 20 years, down four of the last five years. Expiration week as a whole is down slightly more than half the time since 1990, but some of the losses have been steep (-2.6% in 1990, -2.3% in 1992, -4.1% in 1997, -4.0% in 2011 and 2.2% in 2013). The week after expiration is mildly stronger up 15 of the last 25.
| August Vital Stats (1950-2014) |
| |
DJI |
SP500 |
NASDAQ |
Russell
1K |
Russell 2K |
| Rank |
|
10 |
|
10 |
|
12 |
|
9 |
|
9 |
| #
Up |
|
37 |
|
36 |
|
24 |
|
23 |
|
21 |
| #
Down |
|
28 |
|
29 |
|
20 |
|
13 |
|
15 |
| Average
% |
|
-0.1 |
|
0.005 |
|
0.3 |
|
0.4 |
|
0.4 |
| 4-Year Presidential Election Cycle Performance
by % |
| Post-Election |
|
-1.8 |
|
-1.5 |
|
-1.5 |
|
-1.5 |
|
-0.7 |
| Mid-Term |
|
-0.7 |
|
-0.4 |
|
-1.8 |
|
-0.1 |
|
-1.9 |
| Pre-Election |
|
1.4 |
|
1.0 |
|
1.4 |
|
1.0 |
|
0.7 |
| Election |
|
0.8 |
|
1.0 |
|
2.9 |
|
2.2 |
|
3.5 |
| Best & Worst August by % |
| Best |
1982 |
11.5 |
1982 |
11.6 |
2000 |
11.7 |
1982 |
11.3 |
1984 |
11.5 |
| Worst |
1998 |
-15.1 |
1998 |
-14.6 |
1998 |
-19.9 |
1998 |
-15.1 |
1998 |
-19.5 |
| August Weeks by % |
| Best |
8/20/82 |
10.3 |
8/20/82 |
8.8 |
8/3/84 |
7.4 |
8/20/82 |
8.5 |
8/3/84 |
7.0 |
| Worst |
8/23/74 |
-6.1 |
8/5/11 |
-7.2 |
8/28/98 |
-8.8 |
8/5/11 |
-7.7 |
8/5/11 |
-10.3 |
| August Days by % |
| Best |
8/17/82 |
4.9 |
8/17/82 |
4.8 |
8/9/11 |
5.3 |
8/9/11 |
5.0 |
8/9/11 |
6.9 |
| Worst |
8/31/98 |
-6.4 |
8/31/98 |
-6.8 |
8/31/98 |
-8.6 |
8/8/11 |
-6.9 |
8/8/11 |
-8.9 |
| First Trading Day of Expiration Week: 1990-2014 |
| #Up-#Down |
|
16-9 |
|
19-6 |
|
21-4 |
|
20-5 |
|
18-7 |
| Streak |
|
U1 |
|
U1 |
|
U5 |
|
U1 |
|
U2 |
| Avg
% |
|
0.3 |
|
0.4 |
|
0.5 |
|
0.3 |
|
0.4 |
| Options Expiration Day: 1990-2014 |
| #Up-#Down |
|
11-14 |
|
12-13 |
|
13-12 |
|
13-12 |
|
13-12 |
| Streak |
|
D2 |
|
D2 |
|
U1 |
|
U1 |
|
D2 |
| Avg
% |
|
-0.2 |
|
-0.1 |
|
-0.2 |
|
-0.1 |
|
0.1 |
| Options Expiration Week: 1990-2014 |
| #Up-#Down |
|
12-13 |
|
15-10 |
|
16-9 |
|
15-10 |
|
17-8 |
| Streak |
|
U1 |
|
U1 |
|
U1 |
|
U1 |
|
U1 |
| Avg
% |
|
-0.3 |
|
0.1 |
|
0.5 |
|
0.1 |
|
0.5 |
| Week After Options Expiration: 1990-2014 |
| #Up-#Down |
|
15-10 |
|
17-8 |
|
16-9 |
|
17-8 |
|
16-9 |
| Streak |
|
U1 |
|
U2 |
|
U2 |
|
U2 |
|
U2 |
| Avg
% |
|
0.4 |
|
0.4 |
|
0.6 |
|
0.4 |
|
0.05 |
| August 2015 Bullish Days: Data 1994-2014 |
| |
14,
18, 19, 27 |
14,
18, 19, 24, 27 |
14,
17-19, 27 |
17-19,
27 |
14, 18, 19, 25 |
| |
|
|
|
|
27, 31 |
| August 2015 Bearish Days: Data 1994-2014 |
| |
3,
13, 28 |
13,
20, 28 |
7,
10, 20 |
13,
28 |
7, 10 |
| |
|
|
|
|
|
|
August 2015 Strategy Calendar
|
|
By:
Christopher Mistal
|
July 28, 2015
|
|
|
|
|
Stock Portfolio Updates: Well Positioned for Rest of Worst Months
|
|
By:
Christopher Mistal
|
July 23, 2015
|
|
|
|
Post “Great Recession” we have had to place much less importance on some of our long-time favorite indicators such as weekly CBOE equity Put/Call ratio and
Investor’s Intelligence Advisors' Sentiment survey. Both of these indicators were once quite useful when trying to confirm market tops and bottoms, but in recent years both have been essentially stuck in narrow ranges and/or apparently just responding to the markets every move. Both remain useful, just not as much as they once were. Today, I am going to add another to the “not so relevant” list, weekly Initial Jobless Claims.
![[Weekly Claims Chart]](/UploadedImage/AIN_0815_20150723_Weekly_Claims.jpg)
This weekly report tells us the approximate number of people filing for jobless benefits each week or more simply, how many people lost a job for whatever reason. It’s seasonally adjusted and subject to some rather large moves and revisions from week to week, but it once correlated quite well with the market’s moves. If weekly claims were trending higher, the labor market was generally weak and in turn the market was weak as well. A declining trend signaled the opposite and the market was generally moving higher.
The trend of weekly Initial Jobless Claims has been down for all of 2015 and the market has only gone sideways. Today, articles with headlines like “Lowest Claims in Four Decades” are followed by analysis that seems to suggest that all is well in the labor market. Fewer people losing their jobs must mean a tight labor market which should lead to rising wages and more spending and in turn more jobs which can only lead to even more growth and continued spending.
Yeah, maybe, except most articles today failed to mention that claims are so low because the labor force participation rate in the U.S. is also at a near four decade low. The smaller the labor force, the fewer the number of weekly claims there will be. As long as the labor force continues to shrink, Jobless Claims will also continue to decline rendering any new “lowest-in-decades” report essentially meaningless.
Stock Portfolio Updates
Over the past six and a half weeks since last update, through the market’s close on July 22, S&P 500 climbed 1.7%. Russell 2000 was up 0.4% over the same time period. Collectively the three Almanac Investor Stock Portfolios advanced 0.7%. Our Mid-Cap stocks performed best, gaining 3.4%. Our Large-Cap portfolio was second best, up 0.9% while Small-Caps slipped 0.2%. All the damage in the Small-Cap portfolio can be attributed to ChipMOS Technologies (IMOS) as it fell from nearly $23 last update to $17.70 yesterday. Along the skid lower, IMOS first closed below its stop loss on July 20, resulting in the closure of this position for an 11.7% gain.
Our long holdings in both the Mid- and Large-Cap portions of the Stock Portfolio continue to perform well with the exception of Southern Copper (SCCO) which looks like it will get stopped out today. (If stopped out, SCCO will be addressed in the next update) Amerco Inc (UHAL), Jetblue Airways (JBLU), Lithia Motors (LAD), Gildan Activewear (GIL), Fidelity National Finance (FNF) and UnitedHealth Group (UNH) have all traded at new 52-week highs at one time or another over the past few weeks. All long positions in the Mid- and Large-Cap portfolio are on HOLD.
Earlier this month we presented a basket of
14 stocks that we believe are excellent candidates to short. There were three small-caps, three mid-caps and eight large-cap stocks to choose from. All 14 appear in the Stock Portfolio and can be quickly identified by having “(S)” following their names. Thus far, eight have reached one of their two respective price targets to establish a short trade.
Tronox Ltd (TROX) and
Cree Inc (CREE) were shorted when they broke down through support however; both bounced and closed above their stop losses resulting in a small 5% loss being realized on both positions.
BKEP, CQP, CL, MCD, PM and PX were also shorted at various times over the past few weeks. These positions are on Hold. SKYW, LECO, VMI, BLUE, and IRM have not been shorted yet and can be shorted either near resistance (the higher price in “Current Advice”) or on a breakdown below support (lower price in “Current Advice”). Norfolk Southern (NSC) has broken down below support at $84.80 today and will be updated in the Portfolio later.
Active traders can consider our short stock ideas while others may prefer the comfort of cash. No matter the situation, our stock portfolio currently offers both which we feel is the best approach to weathering the worst two months of the year, August and September that are just around the corner. All other positions, not specifically mentioned above, are on Hold. See table below for updated Stop Losses.
|
ETF Portfolio Updates: Stick to Playbook, Worst Two Months August & September Nearly Here
|
|
By:
Christopher Mistal
|
July 21, 2015
|
|
|
|
Beyond the heat wave impacting the East Coast the past few days, NASDAQ has also been red-hot the past two weeks. At yesterday’s close, NASDAQ was at another new all-time high and up 4.7% so far in the month of July. Looking back in our database, NASDAQ has only been up 4% or more for the full-month of July twelve times in its 44 year history.
The best July was a 10.5% gain in 1997 while recent hot NASDAQ Julys were frequently followed by a cool August. Four of six Augusts following NASDAQ July gains of 4% or more since 1997 have been negative. After a 6.9% advance in July 2010, NASDAQ dropped 6.2% in August. The two years when NASDAQ was up in July and August were 2003 (bear market ended in October 2002) and 2009 (bear ended in March).
ETF Portfolio Updates
In the two weeks since last update, the market has found support and bounced notably higher. iShares 20+ Year Treasury Bond (TLT) and iShares Core US Aggregate Bond (AGG) are essentially unchanged. TLT is a few cents higher while AGG is a few cents lower. Excluding dividends, TLT is down 3.4% while AGG is off 1.2%. AdvisorShares Ranger Equity Bear (HDGE) has also slipped, but is still holding onto a 2.1% gain. HDGE, TLT and AGG could be considered on dips below their respective buy limits.
Crude oil’s rout persisted longer than expected and United States Oil (USO) was stopped out on July 17 when it closed below its stop loss of 17.00. Traders and investors remain heavily focused on supply and U.S dollar strength. There is sufficient supply today and there is the prospect of even more from Iran should sanctions be eased, but lower prices are causing a pickup in demand. According to the EIA’s Weekly Petroleum report from last week, total product supplied to market over the past four-week period was up 3.6% compared to the same period a year ago while inventories declined. Enjoy lower pump prices while they last.
New ETF Trade ideas presented early this month have not been added to the portfolio yet. IBB and IYW both came within a few percentage points of their buy limits, but neither traded below. With the market looking toppy and possibly rolling over once again, buy limits for IBB and IYW remain unchanged for now.
Of the three new Seasonal Sector Trade ideas presented this month, ProShares UltraShort S&P 500 (SDS) and First Trust ISE-Revere Natural Gas (FCG) have been added to the portfolio. SDS was added on July 14 at $20.08 when SPDR S&P 500 (SPY) traded above $210.56 for the first time. SDS is on Hold with a 5% trailing stop loss (based upon daily closing prices). FCG is on a wild ride. It traded just below its buy limit on July 16 and then crashed to just three cents above its stop loss two days later. An East Coast heat wave is giving natural gas a boost which is in turn helping FCG today. FCG is on Hold while United States Natural Gas (UNG) can be considered on dips.
Short positions in XLF, IYT and XLB are mostly performing. XLF is refusing to decline as numerous analysts remain bullish on banks. They expect big profits from a steepening yield curve however; at least one bank has already adjusted its strategy because it does not expect the Fed to raise rates anytime this year. Without higher rates soon, the banks are still excellent short candidates. Associated stop losses have been updated in the table below.
The balance of the portfolio is on Hold. See table below for updated stop losses.
Disclosure Note: At press time, officers of the Hirsch Organization, or accounts they control held a position in USO.
|
Mid-Month Market Update: Greece Debacle Distorts Seasonal Forces
|
|
By:
Christopher Mistal
|
July 16, 2015
|
|
|
|
Greece’s latest debt crisis appears to have come to an end as terms for another bailout have finally been hammered out. The effects of missed deadlines and hardline politics ahead of the latest deal were the extension of typical end-of-Q2 market weakness into the start of July and the delayed arrival of NASDAQ’s 12-day mid-summer rally. “Christmas in July” usually runs from the third-to-last trading day in June through the ninth trading day of July for NASDAQ. Thanks to the current brisk rally that began on July 9, this year’s 12-day span suffered only a modest 0.1% loss, the first decline in six years. However, as of yesterday’s close NASDAQ is up 2.2% this July; and even more today.
![[NASDAQ Mid-Summer Rally]](/UploadedImage/AIN_0815_20150716_NASDAQ_Summer_Rally.jpg)
The market may not be staying exactly on seasonal course, but it has been respectably close even with the influence of Greece. There was a late-June selloff followed by a brisk first-half July rally. The sharp market reversal has lifted the major indices back above their respective 200-day (solid red line) and 50-day moving averages (solid magenta line) and even up through projected monthly resistance (red dashed lines). Stochastic, relative strength and MACD indicators are all confirming the shift in momentum, but are also beginning to show signs of being stretched.
This brisk market rally and the accompanying swing positive by technical indicators is setting up nicely for the
mid-July S&P 500 short trade detailed last week.
SPDR S&P 500 (SPY) has rallied up to and just slightly above monthly resistance at $210.56 resulting in the addition of
ProShares UltraShort S&P 500 (SDS) to the ETF Portfolio on the close on July 14 at $20.08. Based upon this price and our 5% trailing stop rule, the
stop loss on SDS is $19.08.
We are also using this rally to add
short stock ideas to the Stock Portfolio presented on July 2. For now we continue to stick to the game plan for the “Worst Six Months.” Hold on to winners, limit new longs, protect gains with tighter stop losses and consider some defensive trades such as bond ETFs and outright short positions. Spending the summer in cash awaiting the next seasonal buying opportunity later this year is also a great way to avoid market volatility.
|
Tepid Second Half Likely Following Flat First Half
|
|
By:
Christopher Mistal
|
July 14, 2015
|
|
|
|
At the midway point this year DJIA was down 1.1% and S&P 500, was essentially unchanged with a fractional gain of 0.2%. Last year the market was in a similar position at the midway point. DJIA was up just 1.5% and S&P 500 was up 6.1%. In the second half of 2014, DJIA climbed 5.9% from the end of June to the end of December and finished the year up 7.5%. S&P 500 added an additional 5% and finished 2014 with a respectable 11.4% full-year gain. However, this type of first-half performance is not all that uncommon. In 65 years since 1950, DJIA has been flat (defined as down less than 5% or up less than 5%) 21 times. Within these 21 years, S&P 500 was also flat 15 times.
![[Flat First Halves since 1950 Table]](/UploadedImage/AIN_0815_20150714_Half_table.jpg)
Following flat first halves, full-month July performance was well above average at 1.9%. In all Julys since 1950, DJIA and S&P 500 averaged gains of 1.2% and 1.0% respectively. However, after July’s surge the market then tended to drift sideways to lower from August through the end of October. At which time a mild fourth quarter rally pulled the market modestly higher. Were the market to follow the flat-first-half pattern to yearend, 2015 would be a well below average pre-election year.
![[Flat First Halves One-Year Seasonal Pattern since 1950]](/UploadedImage/AIN_0815_20150714_SP500_Seasonal_first_half.jpg)
![[Flat First Halves One-Year Seasonal Pattern since 1950]](/UploadedImage/AIN_0815_20150714_DJIA_Seasonal_first_half.jpg)
All things considered, the market has shown incredible resilience this year. First quarter GDP was negative, Greece is still struggling with its debts and bailout terms, dragging the Euro zone and its currency lower, China’s stock market hit a ceiling and tumbled dragging hopes of a soft economic landing there lower, plus the Fed would also like to raise interest rates sometime in the near future. This has created uncertainty in the near-term however; beyond this is the prospect of improving economic growth and corporate profits helping the market hold its ground, at least for now.
|
Seasonal Sector Trades: Stocks Fizzle & Natural Gas Sizzles
|
|
By:
By Christopher Mistal & Jeffrey A. Hirsch
|
July 09, 2015
|
|
|
|
Selling the September S&P 500 futures contract on or about July 15 and holding until on or about July 24 has a 60.6% success rate registering 20 wins against 13 losses in the last 33 years. The best win was $19,150 in 2002, and the worst loss was in 2009, posting a $12,650 bereavement. This trade had been successful in 13 of 15 years from 1990 to 2004. However since then it has nearly the opposite record, posting losses in eight of the last ten years. In these recent years, weakness did materialize however, it was not perfectly aligned with the window defined b this trade. In some years weakness arrived early and was fleeting wile in other years it was later and lasted into the early part of August. This year the setup is compelling as the market has is already struggling during its typically seasonally favorable first half of July.
![[July Short S&P 500 (September Contract) Trade History]](/UploadedImage/AIN_0815_20150709_SP_History.jpg)
![[S&P 500 (SP) Weekly Bars (Pit Plus Electronic Continuous contract) & Seasonal Pattern since 1982]](/UploadedImage/AIN_0815_20150709_SP_Seasonal.jpg)
Looking at the chart above, you will see the average price tendency is for a summer sell-off that usually begins in mid-July and lasts until mid-October. Part of the reason is perhaps due to the fact that July starts the worst four months of the year for NASDAQ and also falls in the middle of the worst six months for DJIA and S&P 500. Mid-July is also when we typically kick off earnings season, where a strong early month rally can fade, as active traders may have “bought the rumor” or bought ahead on anticipation of good earnings expectations and then turn around and “sell the fact” once the news hits the street.
For the Almanac Investor ETF Portfolio, our top choice to execute a trade based upon this seasonality is ProShares UltraShort S&P 500 (SDS). This trade is not for the faint at heart or those without the desire or ability to routinely monitor as SDS is leveraged two times the daily move of the S&P 500. This relationship can be seen in the following chart comparing SDPR S&P 500 (SPY) (daily bars) to SDS (solid black line). We will add SDS to the ETF Portfolio if SPY breaks down below its projected monthly support (green dashed line) at $203.25 or near monthly resistance (red dashed line) at $210.56. Once added to the ETF Portfolio, a 5% trailing stop loss, based upon daily closing prices of SDS, is suggested.
Summer Heat Gives Natural Gas a Boost
Seasonally, July is a good month to get long natural gas ahead of its best five months, August through December. Buying the November natural gas futures on or about July 24 and holding until about October 21. In the past 25 years, this trade has worked 13 times, for a success rate of 52%. Mild winter weather and ample supplies have led to a glut in natural gas in recent years resulting in losses for this trade in seven of the last nine years. Approach this trade with caution.
![[July Long Natural Gas (September Contract) Trade History]](/UploadedImage/AIN_0815_20150709_NG_History.jpg)
This unique commodity has a dual demand season based on hot and cold weather temperatures. In the United States, natural gas, coal, and refined petroleum products are used as substitutes in electric power generation. Electric power generators switch back and forth, preferring to use whichever energy source is less expensive. Seasonal spikes in demand can be seen in the chart below, as increased summer electricity demands from air conditioning usually begins lifting prices in July and August. As the summer season exits, weather can still play a role in September, when hurricanes can and have threatened production in the Gulf of Mexico, as occurred with Hurricane Katrina.
![[Natural Gas (NG) Weekly Bars (Pit Plus Electronic Continuous contract) & Seasonal Pattern since 1990]](/UploadedImage/AIN_0815_20150709_NG_Seasonal.jpg)
Besides options on futures, traders can take advantage of these seasonal price moves with United States Natural Gas (UNG), a futures based ETF, or an ETF that owns the stocks of companies that find, produce, develop, and distribute natural gas like First Trust ISE-Revere Natural Gas (FCG). After surging at different times earlier this year and subsequently retreating, UNG and FCG are attractive near current levels. UNG can be considered on dips below $12.15 (stop loss $10.94) and FCG on dips below $8.20 (stop loss $7.40). UNG and FCG will be tracked in the ETF Portfolio.
|
ETF Trades: Defense Begins Paying Off & Two New Longs to Consider
|
|
By:
Christopher Mistal
|
July 07, 2015
|
|
|
|
Today’s late-trading-session rally may have had a profound impact on the outcome of all of July’s performance, based upon historical data since 1950. Had the S&P 500 finished the day where it was mid-morning, the first four trading days of July would have been negative. When the first four trading days were negative before, full-month July was also down 69.6% of the time with an average loss of 1%. However, when S&P 500 finished the first four days positive, full-month July was also positive 66.7% of the time with an average gain of 2.0%. A single day’s trading has raised the odds of a full-month advance from just 30.4% to 66.7%.
New Trade Ideas for August Seasonalities
Biotechnology sector enters its historical favorable season in August. iShares NASDAQ Biotech (IBB) could be bought on dips below $350.00. The stop loss is $315.00 and auto sell is $492.80. A 28.0% average gain has occurred over the last 15 years while an average gain of 29.1% has taken place the most recent 5 years. There is no doubt that biotech has been hot in recent years and even though valuations are not all that attractive, this is where growth can be found. It is also quite likely that this sector will play a significant part in the next secular bull market. After peaking in late June, IBB has come under some pressure along with the broader market. Stochastic, relative strength and MACD indicators are confirming the loss of momentum but have yet to reach oversold territory. Look for an improving technical picture after any dip below its 50-day moving average as an opportunity to establish new long positions.
![[iShares NASDAQ Biotech (IBB) Daily Bar Chart]](/UploadedImage/AIN_0815_20150707_IBB.jpg)
Over the last 15 years, High-Tech has generated an average return of 15.1%, and for the last five years the average has improved to 19.3% during its bullish season from mid-August to mid-January. Our top ETF within this sector is iShares DJ US Tech (IYW). A buy limit of $100.25 and stop loss of $90.23 are appropriate. If high-tech produces above average gains, profits will be taken at the auto sell of $126.93. After spending nearly three months (March to May) in a holding pattern, IYW briefly broke out in late May, but quickly failed at resistance (red dashed line) and has struggled since. Look to enter a new IYW position on any pullback back to its January/February lows which are just below its current 50-day moving average.
ETF Portfolio Updates
Since doubling down on defensive positions in HDGE, TLT and AGG when we
issued our official Seasonal MACD Sell for NASDAQ, the market has taken a turn for the worse. This has aided these defensive positions. As of yesterday’s close, HDGE was up 2.7% while TLT and AGG were closing in on breakeven. Today’s wild market ride has left bonds modestly higher and HDGE slightly lower.
Ahead of crude oil’s recent rout, SPDR Energy (XLE) was stopped out on June 29, when it closed below $74.65. Since energy stocks typically fall out of favor around the beginning of July, no new trade will be considered now. Crude’s decline has also erased nearly all of the United States Oil Fund (USO) had racked up. Over-supply fears, a strengthening U.S. dollar and general global growth concerns have all weighed heavily on price. Today’s wild ride by USO suggests the selloff may be coming to an end. Tomorrow’s weekly petroleum status report will be the next catalyst to move oil. Focus on the demand numbers more so than the supply numbers. We all know there is plenty of oil available today, but what about tomorrow when U.S. demand is solidly rising again?
The strengthening dollar has also plagued another position in the ETF Portfolio, Market Vectors Gold Miners (GDX). This trade was likely executed too early as seasonal strength in gold & silver stocks does not typically begin until the end of July. Nonetheless, GDX closed below its stop loss today and will be closed out of the portfolio in the next update.
Short positions in XLF, IYT and XLB have done well recently and remain on Hold. Associated stop losses have been updated in the table below.
With the exception of today’s new trade ideas the rest of the portfolio is on Hold. See table below for updated stop losses.
Disclosure Note: At press time, officers of the Hirsch Organization, or accounts they control held a position in USO.
|
Summer Shorts: A Basket of Less than Desirable Stocks
|
|
By:
By Jeffrey A. Hirsch & Christopher Mistal
|
July 02, 2015
|
|
|
|
I just updated my “count” on George Lindsay’s old Three Peaks and a Domed House Top Pattern (3PDH). While I am becoming increasingly concerned that the long averted 10% correction has even greater potential to occur over the next few months, I am not expecting a bear market to ensue just yet.
This illustration below of the potential current 3PDH is not what I believe. This is my interpretation of how 3PDH could play out should it continue. I think we are primed for a correction this summer or fall maybe ~10% give or take a few percentage points. But the U.S. market remains resilient. We are defensively positioned at the moment with solid positions on hold, tightened stops, and some downside positions. And today we present some overvalued weak stocks in weak sectors to consider shorting.
The term “Three Peaks and a Domed House Top” is just an easy way to remember and recognize this recurring market pattern. Occurring at nearly every major U. S. equity market top, the pattern illustrates consistent market behavior. The Domed House Top is akin to a head-and-shoulders top.
The pattern describes how markets tend to come off a low and move up until a resistance point is reached (point 3). Then after two attempts to move higher (points 5 and 7) there is a sell-off to point 10. This is the “Separating Decline” that separates the Three Peaks from the Domed House. Point 10 is always lower than either point 4 or 6, often both. If is not lower it does not qualify and the pattern is nullified. The Domed House starts with a base between points 10 and 14. A rally usually ensues and forms another higher base (points 15 to 20, Roof of the First Story). Then from there the final surge to the high creates the Dome from points 21 to 25. The drop-off returns to the vicinity of point 10.
Lindsay based these formations after studying 150 years of market charts back in 1968. When looking at the point 23 dates in Lindsay’s original work we noticed that they all matched up with a bull market high in the Stock Trader’s Almanac (2015 page 131). Additionally, Lindsay stated that the pattern “may occur on either a major or minor scale. When it is of major scope, a typical formation begins at a bear market low.”
Lindsay noted that minor and major formations of Three Peaks and a Domed House often overlapped with a Peak of one being a Dome of another. Sometimes Three Peaks followed a Domed House. Some tops could not be fit into the pattern and do not qualify. But Lindsay did find that, “…the market has followed [the formations] at least 60% of the time…” and that, “The majority of all major advances ended in a pattern which resembled the Three Peaks and a Domed House.”
Short Stock Basket
This basket of 14 possible stocks to short spans the three market cap ranges in the Almanac Investor Stock Portfolio. There are three Small-Cap stocks (less than $1 billion), three Mid-Cap stocks (greater than $1 billion but less than $5 billion) and eight Large-Cap stocks (greater than $5 billion in value). Our screening process involved an in-depth review of fundamentals, such as revenues and earnings, valuation metrics like price-to-earnings and price-to-sale ratios, each stock’s technical situation as well as price and daily trading volume. Seasonally weak sectors, like materials, transports and cyclicals were also given extra attention and produced nearly half of the stocks in the basket.
The broad criteria for inclusion on this list relied primarily on revenues and earnings (past and future estimates). Generally, stocks that are exhibiting decelerating, flat or negative revenues ranked high on our list of short candidates. From this batch earnings also needed to be decelerating, flat, negative or estimates are weak. Out of this trimmed list, stocks with elevated P/E and/or P/S ratios were retained. Finally share price and volume were considered. From a list of several thousand stocks, these 14 remained. There are worse stocks out there, but many of them had already fallen a substantial distance. Whereas, this basket still offers plenty of downside potential in coming months. Some are trading near 52-week lows while others maybe just a few percentage points off of 52-week highs.
Be patient as the first half of July is historically bullish, but afterwards the worst-two-consecutive-month span, August through September, begins. Like past short trade ideas, there are two possible prices presented to establish a short position. The first is labeled “Short @ Resistance” in the table below. Should a stock rally toward this price then stall and loss momentum a short trade can be considered. Look for corresponding weakness by MACD, Stochastic and relative strength indicators to confirm. If a stock is shorted at or near the price in the “Short @ Resistance” column, use the higher stop loss adjacent. The second price to consider shorting the stock is listed in “Short on breakdown below”. This is the stock’s current projected support level. If the stock breaks support a short trade can be considered. If you short on a breakdown, employ the lower of the two stop losses listed. All 14 short stock ideas will be tracked in the Almanac Investor Stock Portfolio.
![[Summer Shorts Stock Table]](/UploadedImage/AIN_0815_20150702_Short_Stock_Basket.jpg)
Disclosure Note: At press time, officers of the Hirsch Organization, or accounts they control did not hold any positions in the stocks mentioned, but may buy or sell at any time.