|
Market at a Glance - 9/23/2021
|
|
By:
Christopher Mistal
|
September 23, 2021
|
|
|
|
9/23/2021: Dow 34764.82 | S&P 4448.98 | NASDAQ 15052.24 | Russell 2K 2259.04 | NYSE 16567.26 | Value Line Arith 9586.45
Fundamental: Decelerating. According to the Atlanta Fed’s GDPNow Forecast, Q3 growth is projected to be 3.7% as of its update on September 21, down from 5.7% in its August 25 projection. August’s jobs report was also a major disappointment with only 235k net jobs added versus expectations around three times higher. However, these are still respectable growth and jobs numbers when compared with pre-covid data.
Technical: Consolidating. At the closing lows of the pullback earlier this week, DJIA, S&P 500 and NASDAQ were all below their respective 50-day moving averages. DJIA had been meandering since mid-August while S&P 500 and NASDAQ moved modestly higher into early September before all retreated. The pullback has reset Stochastic, relative strength and MACD indicators. The recent rebound has been confirmed by a Stochastic crossover, but not by MACD.
Monetary: 0 – 0.25%. As widely anticipated the Fed left interest rates unchanged and continued preparing the market for an eventual tapering of its asset purchase program (QE). Inflation hawks that were expecting action at this meeting were left disappointed and the “all clear” flag for stock buying continues to fly at least until the next Fed meeting. In post-meeting comments Fed Chairman Powell said the committee is ready to move and suggested that tapering could be completed by mid-2022. More Fed members are also projecting a rate hike in 2022.
Seasonal: Improving. October is the last month of the “Worst Six Months” for DJIA and S&P 500 and the last month of NASDAQ’s “Worst Four Months”. In post-election years October ranks mid-pack with average performance ranging from 0.9% (DJIA & Russell 1000) to 1.4% (NASDAQ). Keep an eye out for our Official MACD Seasonal Buy Signal. It can trigger anytime on or after October 1. An email Alert will be sent when it triggers.
Psychological: Correction. According to
Investor’s Intelligence Advisors Sentiment survey Bullish advisors have slipped down to 47.1%, their lowest number since May 2020. Correction advisors stand at 30.6% while Bearish advisors have crept up to 22.3%. Overall sentiment has slipped to neutral. Based solely upon sentiment it is neither a great time to be selling or a great time to be buying.
|
October Outlook: Market Likely Wards Off October’s Curse?
|
|
By:
Jeffrey A. Hirsch & Christopher Mistal
|
September 23, 2021
|
|
|
|
Well. Seasonality is back. Everyone in the financial media has been talking about September seasonal weakness lately. And here we are in September and the market has sold off the 5% or so we projected last month. And it did so in the notoriously treacherous week after September quarterly options and futures expiration.
Then as expected traders and fund managers bought the 5% dip as they have throughout this bull market rally with the blessing of the Federal Reserve’s continuing dovish tone and accommodative policy that they reinforced at the conclusion of yesterday’s FOMC meeting.
We do not expect stocks to succumb to the October curse this year. That doesn’t rule out some downside disturbance, but we do not foresee an impending crash, massacre or big selloff of the sort that have given October it’s dubious reputation as the jinx month. Many of the same geopolitical, political, fundamental and technical headwinds we highlighted last month remain, as well as some others, so another 5% or so pullback is quite likely as Wall Street still may suffer from chronic “Octoberphobia.”
We’ve been doing this for decades and this pullback was prototypical end of Q3 window dressing and institutional selling. Several factors weighed on the markets, but most had been there all year. So why did the market selling off this month? Seasonality.
As you can see in the chart here of the updated S&P 500 One-Year Seasonal Pattern Since 1949, over the last 72 years and the more recent 33 years, late September weakness is apparent (noted by purple arrows) along with the October turn and strong year-end rally that runs through the Best Six Months that end in April.
Last year we had a November for the record books with a rally that continued beyond yearend into late April/early May as you can see here in the green line. Then we suffered some usual May/June weakness, followed by a customary mid-year rally with the usual first half of July strength. August was unseasonably strong except for the 2% correction mid-month and now September has delivered its vaunted selloff.
We’ve seen this September weakness before and expect this turnaround to continue with a strong potential for retest of the recent lows in October as is often the case with either a slightly higher or lower low – a higher low would clearly be more constructive.
So we stick with the system which is designed to avoid and capitalize on seasonal September weakness and jump on the October turn with our MACD Best Six Months Seasonal Buy Signal. The upcoming Best Six Month promises to deliver like it did last year and year in and year out.
Nothing is perfect or works all the time and we’ve seen some bad Best Six Months over the years, but they have been few and far between (see page 54 of the 2021 Almanac). The Best Months with MACD timing has trounced the Worst Months with a gain of 8.9% for DJIA vs. -0.4% (updated numbers from the 2022 Almanac out next month). Even over the past 12 years since the March 2009 bottom the Best Six Months have doubled the performance of the Worst Months.
There are several issues that could trigger an October slide. The Chinese Evergrande crisis seemed more like an excuse for the recent selloff and we suspect that the Chinese government will coordinate and control a solution there and curtail any fallout. There’s the debt ceiling issue. We been here before and Congress will likely wait until the 11th hour, but they will raise it and not put the full faith and credit of the U.S. government at risk.
The tax increase many fear is looking less and less likely to pass as the proposal is being met with resistance from many camps and President Biden’s approval ratings have slipped. Inflationary pressures are proving to be somewhat transitory. Yes inflation will be increasing as it usually does, but rampant inflation does not appear to be a concern.
Any increased chatter about the Fed raising rates sooner than later in 2022 is likely the biggest risk to stock prices. Since the market has a history of October turnarounds, whatever it is that may trigger another bout of weakness in October, please don’t react and get flushed out of the market. Instead be ready to act on our next Best Six/Eight Months MACD Seasonal Buy Signal that can occur any time on or after October 1.
Pulse of the Market
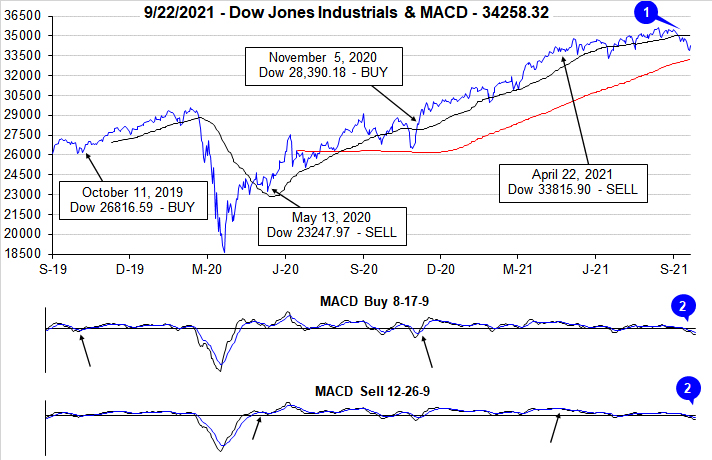
After a tepid finish to August, DJIA’s struggles only grew in September. Seasonally, this is not a surprise as September has been the worst month of the year for DJIA since 1950. DJIA closed below its 50-day moving average (1) on September 9 and has remained below it since then. The current streak of closes below DJIA’s 50-day moving average is the longest streak since the pandemic erupted and the market sunk last year in March. Both the faster and slower moving MACD indicators (2) applied to DJIA have been negative and trending lower since mid-August confirming the loss of positive momentum and the change in direction by DJIA.
In addition to negative MACD indicator signals, DJIA logged its fourth Down Friday/Down Monday (DF/DM) warning of the year on the first Friday and Monday of September. This DF/DM was promptly followed by a 2.15% weekly DJIA loss during the week ending September 10. DJIA then recorded its fifth DF/DM (3) at the start of this week. Historically a cluster of DF/DM’s like that which just occurred has frequently marked a significant inflection point for the DJIA.
Based upon past DF/DM clusters, should DJIA quickly recover the losses and return to pre-DF/DM levels, then the worst of the pullback is likely over. However, should the current rally come up short then additional weakness could quickly materialize. DJIA 35,450 and above in the near-term would be positive while any level less than this would be worrisome.
DJIA’s recent weakness has also been accompanied by S&P 500 (4) and NASDAQ (5) weakness. Broad, across-the-board weakness is likely partly due to seasonality and partly due to Fed uncertainty ahead of this month’s regularly scheduled meeting. Based upon the last two trading days, the market does appear to be pleased with how the Fed is handling policy now, but that sentiment could change.
Market breadth measured by NYSE Weekly Advancers and NYSE Weekly Decliners (6) has been reasonably aligned with weekly performance over the last four weeks. In advancing weeks, Weekly Advancers have outnumbered Weekly Decliners while the opposite has been largely true in down weeks. As observed last month, any divergences from this could be an early indication of market weakness.
During the first two weeks of September trading, Weekly New Highs (7) were trending positive. That was not the case the past two weeks. Weekly New Lows appear to have peaked in August at 248 during the week ending on the 20th and have been declining or trying to decline since. This mixed trend in New Highs and Lows does appear consistent with a market that is only a handful of percentage points from all-time highs.
Interest rates have been relatively stable over the past eleven weeks with the 30-year Treasury yield (8) oscillating right around 1.90%. This would seem to signal that the long-dated end of the Treasury yield curve is more connected to long-term growth and inflation trends rather than what the Fed is doing now or may be doing sometime in the near future.
|
October 2021 Almanac: Resist “Octoberphobia”
|
|
By:
Jeffrey A. Hirsch & Christopher Mistal
|
September 16, 2021
|
|
|
|
October often evokes fear on Wall Street as memories are stirred of crashes in 1929, 1987, the 554-point drop on October 27, 1997, back-to-back massacres in 1978 and 1979, Friday the 13th in 1989 and the 733-point drop on October 15, 2008. During the week ending October 10, 2008, Dow lost 1,874.19 points (18.2%), the worst weekly decline in our database going back to 1901, in percentage terms. March 2020 now holds the dubious honor of producing the worst, second and third worst DJIA weekly point declines. The term “Octoberphobia” has been used to describe the phenomenon of major market drops occurring during the month. Market calamities can become a self-fulfilling prophecy, so stay on the lookout and don’t get whipsawed if it happens.
But October has become a turnaround month—a “bear killer” if you will. Twelve post-WWII bear markets have ended in October: 1946, 1957, 1960, 1962, 1966, 1974, 1987, 1990, 1998, 2001, 2002 and 2011 (S&P 500 declined 19.4%). However, eight were midterm bottoms. Over the last 21 years, October’s performance has been solid. Average gains over the last 21-years range from 0.9% by Russell 1000 and S&P 500 to 1.9% by NASDAQ. Small caps have still struggled though with Russell 2000 gaining a modest 0.6%
Post-election year October’s are neither great nor bad since 1953, ranking mid-pack across DJIA, S&P 500, NASDAQ and Russell 1000 with gains averaging from 0.9% (DJIA & Russell 1000) to 1.4% (NASDAQ). DJIA has the best historical odds for gains having advanced in 12 of the last 17 post-election year Octobers. Despite the best average gain, NASDAQ actually has the worst record, declining in 6 of the last 12 post-election year Octobers. A 12.8% gain in 2001 boosts its average. Should a meaningful decline materialize in October it is likely to be an excellent buying opportunity, especially for any depressed technology and small-cap shares.
![[Post-Election Year October Performance Table]](/UploadedImage/AIN_1021_20210916_PE_October_mini_stats_table.jpg)
Options expiration week in October provides plenty of opportunity. On the Monday before expiration the DJIA has only been down nine times since 1982 and the Russell 2000 is up twenty-three of the last thirty-one years, seventeen straight from 1990 to 2006. Expiration day has a spotty record as does the week as a whole. After a market bottom in October, the week after is most bullish, otherwise it is susceptible to downdrafts.
October is also the end of the Dow and S&P 500 “Worst 6 Months” and NASDAQ “Worst 4 Months”. Remain attentive for our Seasonal Buy Signal which can occur anytime beginning October 1. An email Alert will be sent when it triggers.
![[October 2021 Vital Stats Table]](/UploadedImage/AIN_1021_20210916_October_vital_stats_table.jpg)
|
October 2021 Strategy Calendar
|
|
By:
Christopher Mistal
|
September 16, 2021
|
|
|
|
|
Stock Portfolio Updates: Small- and Mid-Caps Lag
|
|
By:
Christopher Mistal
|
September 09, 2021
|
|
|
|
September is the final month of the third quarter and historically it is essentially tied with August as worst month of the year. Since 1950, September is ranked last for DJIA, S&P 500, NASDAQ (since 1971) and Russell 1000 (since 1979). Small caps, measured by the Russell 2000, have fared slightly better, but historical average performance is still negative. Over the last 21 years, September has generally opened tepidly with mixed performance depending on index with Russell 2000 often rising the most through mid-month. However after mid-month, any gains have tended to fade quickly and turn into losses by month’s end. Sizable losses in 2001, 2002, 2008 and 2011 weigh heavily on average performance.
![[Typical Seasonal September Chart]](/UploadedImage/AIN_1021_20210909_September_Seasonal_21.jpg)
As of today’s close, DJIA, S&P 500, NASDAQ, Russell 1000 and Russell 2000 are all in the red for September. Choppy performance so far this month is in line with historical trends for the first part of the month. Should the market continue to track historical patterns then a modest move higher lasting through mid-month could begin soon. However, as noted above, any mid-month rally is not expected to last long as the week after quarterly options expiration has a horrific record.
Stock Portfolio Updates
Over the last four weeks since last update through yesterday’s close, S&P 500 climbed 1.6% higher while Russell 2000 advanced 0.5%. During the same time period the entire portfolio was basically flat, off 0.005%, excluding dividends and any fees. Small- and Mid-cap positions were weakest down 0.4% and 0.9% respectively. Large caps fared much better climbing 1.4% higher. Several defensive/dividend paying positions (all defensive shaded in light grey) were responsible for the bulk of large-cap gains.
Small-cap weakness was primarily the result of retreats by banking stocks. Atlantic Union Bankshares (AUB), WSFS Financial (WSFS), South State (SSB) and Customers Bancorp (CUBI) all declined. All four positions had and still have solid gains since being added to the portfolio. WSFS and CUBI had previously doubled in value. Their retreat is likely the result of recent Fed news and its impact on Treasury yields. Continue to Hold AUB, WSFS, SSB and CUBI.
Two bright spots in the Small-cap portfolio were MGP Ingredients (MGPI) and Lemaitre Vascular (LMAT). MGPI advanced 3.2% over the last four weeks through yesterday’s close while LMAT jumped 8.6%. Both positions are still below their respective highs reached back in June which suggests further upside is possible. MGPI and LMAT are on Hold.
Mid-cap stocks also struggled over the last few weeks. Stepan Co (SCL) and Werner Enterprises (WERN) were the only two stocks to advance. SCL remains one of only two positions in the red in the entire portfolio since addition but it did make a small amount of progress. WERN is a trucking company and not unlike many other areas of the economy it is experiencing some challenges from the labor market. Another hurdle is regulatory and involves temporary CDLs for which the company is seeking an exemption. The exemption would benefit the company and its new drivers. Recent strength could be an indication that the market does anticipate an exemption to be granted.
Large caps continue to own the spotlight. Even though the majority of the portfolio is defensive and/or dividend yielding, it still managed to keep pace with the S&P 500. There are a few weak spots, most notably AT&T (T) and Verizon (VZ). We do not anticipate either company to double in the next year but we do see them both continuing to pay a dividend that is relatively much better than many other choices. T and VZ are on Hold.
All other positions in the portfolio are on Hold. Please see table below for specific stop losses and current advice for each position.
|
ETF Trades & Updates: Oil’s Seasonal Retreat
|
|
By:
Christopher Mistal
|
September 02, 2021
|
|
|
|
Seasonally speaking in a typical year, crude oil tends to make significant price gains in the summer, as vacationers and the annual trek of students returning to college in August creates increased demand for gasoline. The market can also price in a premium for supply disruptions due to threats of hurricanes in the Gulf of Mexico. However, towards mid-September, we often see a seasonal tendency for prices to peak out, as the driving and hurricane seasons begin to wind down. Crude oil’s seasonal decline is highlighted in yellow in the following chart.
![[Crude Oil (CL) Weekly Bars and Seasonal Trend Chart (Weekly Data September 2020 – September 2, 2021)]](/UploadedImage/AIN_1021_20210902_CL_Seasonal.jpg)
Last time around this trade did not work out all that well. Crude oil had modestly recovered from its historic decline triggered by pandemic shutdowns but was only trading around $40 per barrel in early September of last year. From that early September high to its early November low it only declined to around $35. Oil’s modest price decline appears to have been more of a consolidation period of choppy gains and losses than a typical seasonal retreat due to demand easing. This year oil is trading right around $70 per barrel, down from an early July peak near $75. With this summer being much closer to pre-covid summers in regard to oil demand, this trade appears to be setting up better this time around.
![[ProShares UltraShort Bloomberg Crude Oil (SCO) Daily Bar Chart]](/UploadedImage/AIN_1021_20210902_SCO.jpg)
ProShares UltraShort Bloomberg Crude Oil (SCO) is one vehicle to take advantage of seasonal weakness. SCO’s benchmark is the Bloomberg Commodity Balanced WTI Crude Oil Sub index which is comprised of crude oil futures contracts. SCO is designed to return 200% of the inverse of the daily move of this index and has around $80 million in assets. Its expense ratio of 0.95% is about average for a leveraged, inverse ETF.
Crude oil’s gain this year has caused a corresponding decrease in SCO. Stochastic, relative strength and MACD Buy indicators applied to SCO are at or near over oversold levels due to a recent bounce in oil. SCO could be considered on dips with a buy limit of $17.12. SCO will be tracked in the Almanac Investor Sector Rotation ETF Portfolio. If purchased, an initial stop loss at $15.41 is suggested.
Sector Rotation ETF Portfolio Updates
Even as the S&P 500 enjoyed well above historical average performance in August, defensive positions in the portfolio held up well. Historically boring, SPDR Consumer Staples (XLP) continued its advance and was up 19.4% at yesterday’s close excluding dividends and any trading fees. SPDR Utilities (XLU), another defensive position, also had a respectable August and was up 12.5% at yesterday’s close excluding any dividends or fees.
Healthcare and biotech positions also performed well over the past month with the majority of the gains occurring since just after mid-August. iShares NASDAQ Biotech (IBB) is the top performing position in the portfolio, up 30.5%. In last month’s Alert we were looking to expand the portfolio’s exposure to biotech. IBB did retreat early in August, but never traded below its buy limit. However, SPDR Biotech (XBI) did, and it was added to the portfolio on August 17. Since addition, XBI is up over 13% as of today’s close. IBB and XBI are on Hold.
July’s short trade ideas in the transportation and industrials sectors are having mixed results. iShares Transportation (IYT) and SPDR Industrials (XLI) are currently trading right around the levels they were shorted at. Ample Fed liquidity and fiscal stimulus appears to be staving off typical seasonal weakness for now. Continue to Hold short positions in IYT and XLI with a mindful eye towards their respective stop losses should these trades go further in the wrong direction.
Despite ongoing QE and surging inflation metrics, gold and silver have remained subdued. VanEck Vectors Gold Miners (GDX) was stopped out on August 9 as precious metals retreated in expectation of Fed QE tapering clarification. iShares Silver (SLV) was also stopped out in early August. SPDR Gold (GLD), currently the oldest holding in the portfolio is on Hold.
Tactical Seasonal Switching ETF Portfolio Update
Thus far this “Worst Months” period has been solid when compared to historical average performance. Fed liquidity and near-zero rates have successfully staved off typical seasonal weakness. Such strength, for a second year in a row, likely creates some doubt about the effectiveness of the Tactical Seasonal Switching Strategy. Rather than focusing on this doubt it may be more productive to examine the current investing situation to determine if it is likely to be sustainable going forward. Historical fiscal stimulus from the Federal government just does not feel likely to become a new normal nor does historic levels of Fed liquidity.
The Fed has already signaled its intentions to begin tapering asset purchases and Federal programs are slowly coming to an end. Combined with a slow but steady return to pre-covid activities, the direction the economy appears to be headed in is the same it was before the pandemic. In that situation there is over 70 years of historical data in the Almanac supporting the Switching Strategy. No strategy is perfect 100% of the time and current conditions are (hopefully) not a new normal. We will continue to adhere to the system while continually researching ways to further improve results going forward.
Defensive, “Worst Months” positions in the portfolio continue to perform their function by being a relatively stable and safe place to park cash. AGG and BND are positive with gains of 1.1% each excluding dividends and trading costs. AGG and BND on Hold.