|
Market at a Glance - 4/27/2017
|
|
By:
Christopher Mistal
|
April 27, 2017
|
|
|
|
4/26/2016: Dow 20975.09 | S&P 2387.45 | NASDAQ 6025.23 | Russell 2K 1419.43 | NYSE 11592.91 | Value Line Arith 5433.80
Psychological: Bullish. According to the most recent
Investors Intelligence Advisors Sentiment survey bulls have rebounded to 54.7%, bears are at 17.9% and correction is 27.4%. Bullish sentiment has been on the rise since bottoming in the second half of March. Sentiment is elevated, but not yet in treacherous territory. Now just isn’t the best time to establish new long positions.
Fundamental: Mixed. Corporate earnings for Q1 have largely been a success. S&P Capital IQ estimates an 11.1% year-on-year gain and a new all-time 12-month high in S&P 500 earnings. But, Q1 GDP is anticipated to be an anemic 0.2% based upon Atlanta Fed’s GDPNow model and March’s jobs report was weaker than expected with just 98k net new jobs. Counteracting soft(ish) data and supporting the rally are expectations for tax reform. (After the healthcare fumble, this may not be something to bet big on.)
Technical: Mixed. NASDAQ and Russell 2000 have broken out to new all-time highs this week, but DJIA and S&P 500 are lagging. Bullishly, all four indices are above their respective 50-day moving averages and Stochastic, relative strength and MACD indicators are all positive. NASDAQ and Russell 2000 need to hold onto break out levels and DJIA and S&P 500 will likely catch up and continue on. Previous all-times for DJIA and S&P 500 will offer some resistance, but higher, highs are expected before any substantial pullback transpires later this summer or fall.
Monetary: 0.75-1.00%. Next week, on May 2-3, the Fed will meet again. They will be have a flattening yield curve, a cooling labor market, likely tepid Q1 GDP report and a massive balance sheet to discuss. Unloading some of their longer-dated Treasury holdings would likely prop up the long end of the yield curve, but would likely further cool economic activity. Another increase in rates is not likely at the upcoming meeting.
Seasonal: Neutral. May officially marks the beginning of the “Worst Six Months” for the DJIA and S&P. To wit: “Sell in May and go away.” In post-election years, May ranks 4th for DJIA and #3 on S&P 500 with average gains of 1.3% and 1.7% respectively. Small caps and tech fair better due to their “Best Months” lasting until June. May is the #1 post-election year month for NASDAQ (+3.4%) and Russell 2000 (+4.6%).
|
May Outlook: Best Six Months Rally Continues
|
|
By:
Jeffrey A. Hirsch & Christopher Mistal
|
April 27, 2017
|
|
|
|
Well, patience with our Best Six Months Seasonal MACD Sell Signal has sure proved to be a virtue thus far. Both MACD indicators for both the S&P 500 and DJIA went negative in early March and did not all turn positive until the past Monday’s big gains. Now we are getting some bullish confirmation from market breadth. The cumulative Advance/Declines in several major market indices are trending higher and on the brink of more new highs.
In the chart below you can see that the NYSE Composite A/D Line – the broadest of the bunch and most widely tracked – is already at a new high. In the top pane we show the four major averages: Russell 2000, NASDAQ Composite, S&P 500 and DJIA. In the lower panes are the A/D Lines for S&P, R2K, NASDAQ and NYSE. DJIA only has 30 stocks so the A/D is rather choppy and less instructive.
When A/D Lines move inversely to their related index or average that is usually an indication that the benchmark is about to change course as the bulk of its constituents are moving in a different direction. However, despite all the worrisome talk out there and the Sell in May sabre rattle, underlying strength is improving though there still is some work to be done.
Since the current rally began just before the election back in early November, market breadth has been supportive. Even during the March to mid-April pullback and consolidation the A/D Line followed along. Now the other A/D Lines are trending higher and about to confirm the new highs on NASDAQ and R2K with new highs of their own. We will be looking for market breadth to move higher and confirm our expectation for another move higher before we Sell In May… or later.
May’s across the board major improvement in post-election years is another bullish factor. We also do not expect anything too sinister at this point during the Summer/Fall correction this year. Pundits, politicians and pedestrians on both sides of the aisle and pond continue to banter about how the Trump rally is doomed. But we are not convinced just yet.
President Trump continues to compromise, negotiate, wheel and deal. Yes he's said some inflammatory things and made some diplomatic and military maneuvers and used any manner of political tactics, but Congress is still gridlocked and Trump has the world on their heels, hands up in the air and confused as to what his next move will be. He is looking more and more presidential and his team is evolving. Perhaps all this bluster is keeping the wolves at bay. The market sure is acting happy.
Trump still has loads of work to do. His tax plan received a big yawn as it lacked detail. The move to repeal Obamacare is weakly back on table. A government shutdown is not likely to happen; Trump will make a deal and compromise. His tough talk has the world a bit baffled and while Dems and Reps are still yapping away in DC and not doing much the market rally rolls on.
Fear not though. We are prepared. When the MACD Sell Signal triggers we will move quickly to tighten up and lighten up and put the prevent Defense on the field. As our friend and market sage Art Cashin says every day in his daily missive, “Stick with the drill – stay wary, alert and very, very nimble.” Our system, tactics and 5-discipline-approach continues to produce. We will sell losers and underperformers in May on MACD trigger, but hold winners, protect profits and prep some downside protection and bearish seasonal trades.
Pulse of the Market
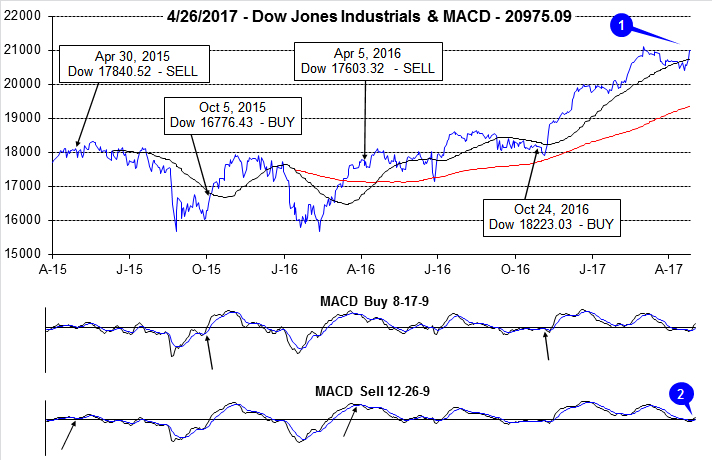
Up until this week, April had been failing to live up to its reputation as DJIA’s historically top-performing month. DJIA briefly lost its battle with its 50-day moving average (1) around mid-month. But, DJIA did find support right around its projected monthly pivot support level at 20327. This Tuesday, DJIA decisively reclaimed its 50-day moving average and the surge higher was sufficient to turn both the faster moving and slower moving MACD indicators positive (2) for the first time since early March.
During the second half of March and the first trading day of April, DJIA recorded three consecutive Down Friday/Down Monday occurrences (4). The last time DJIA did this was in February 2009 just before the worst bear market since the Great Depression ended on March 9. A cluster like this demonstrates a major lack of confidence in the market and bearish overall sentiment as traders and investors are reluctant to carry positions over the weekend and fail to buy again on Monday. DJIA has fallen on Friday (or the last trading day of the week) for six straight weeks. For the last three weeks, buying near the close on Friday would have been the better long trade.
Prior to this week, DJIA (3), S&P 500 (5) and NASDAQ (6) logged losses in four of the last seven weeks. Relatively mild weekly losses combined with a few modest weekly gains have kept all three indices within a few percentage points of recent all-time highs. In typical seasonal fashion, technology shares have been leading the way higher with NASDAQ closing at a new all-time high first on April 20. Since then, NASDAQ has continued to build on strength and now trades above 6000 and new all-time highs.
March’s see-saw battle between NYSE Weekly Advancers and Decliners (7) has persisted through the bulk of April. A lone exception transpired during the week ending April 7 when DJIA, S&P 500 and NASDAQ all declined, but NYSE Weekly Advancers still outnumbered NYSE Weekly Decliners. A consistently larger number of Weekly Advancers would aid in supporting another move higher.
Despite all the recent weakness, NYSE Weekly New Highs (8) have held up and have not slipped below 200 since early March. This is bullish as it indicates underlying strength and resiliency that is not easily measured. Ideally, we would like to see New Weekly Highs continually expanding. This could serve as one confirming data point that the rally still has room left yet to run.
After two Fed Funds rate increases (December and March), the yield on the 30-year Treasury bond (9) is back under 3% and at its lowest since right after Election Day 2016. The spread between 90-day rate and 30-year rate has narrowed all the way back to what it was last October. Part of the decline in yields could be attributed to a “flight to safety” during recent weakness in advance of the “Worst Six Months” and another reason for the decline is still tepid growth and inflation expectations. A flattening yield curve also explains some of the weakness in some bank stocks recently.
|
May Almanac: Better in Post-Election Years
|
|
By:
Jeffrey A. Hirsch & Christopher Mistal
|
April 25, 2017
|
|
|
|
As of the today’s close, both the faster moving MACD “Buy” and slower moving MACD “Sell” indicators applied to DJIA and S&P 500
are positive (shaded in yellow with blue arrows).
Continue to hold long positions associated with DJIA’s and S&P 500’s “Best Six Months.” We will issue our Seasonal MACD Sell signal when corresponding MACD “Sell” indicators applied to DJIA and S&P 500 both crossover and issue a new sell signal.
May Almanac
May has been a tricky month over the years, a well-deserved reputation following the May 6, 2010 “flash crash”. It used to be part of what we called the “May/June disaster area.” From 1965 to 1984 the S&P 500 was down during May fifteen out of twenty times. Then from 1985 through 1997 May was the best month, gaining ground every single year (13 straight gains) on the S&P, up 3.3% on average with the DJIA falling once and two NASDAQ losses.
In the years since 1997, May’s performance has been erratic; DJIA up nine times in the past nineteen years (three of the years had gains in excess of 4%). NASDAQ suffered five May losses in a row from 1998-2001, down – 11.9% in 2000, followed by ten sizable gains in excess of 2.5% and four losses, the worst of which was 8.3% in 2010.
Post-election-year Mays rank at or near the top. May is the top performing NASDAQ and Russell 2000 month in post-election years. The Russell 2000 has been up 9 straight with gains averaging a whopping 4.6%. DJIA and S&P 500 (since 1953) have been nearly as strong, with May ranking 4th and 3rd respectively.
May begins the “Worst Six Months” for the DJIA and S&P. To wit: “Sell in May and go away.” Our “Best Six Months Switching Strategy,” created in 1986, proves that there is merit to this old trader’s tale. A hypothetical $10,000 investment in the DJIA compounded to $843,577 for November-April in 66 years compared to $319 loss for May-October.
Monday before May option expiration is much stronger than expiration day itself albeit weaker for small caps. Big caps have only registered seven losses in the last twenty-nine years. Expiration day is a loser nearly across the board; Russell 2000 posts a marginal average gain. The full week had a bullish bias that has faded in recent years. The week after options expiration week now favors tech and small caps. DJIA has fallen in eleven of the last eighteen weeks after.
On Friday before Mother’s Day, DJIA has gained ground fifteen of the last twenty-two years and on the Monday after the blue-chip average has also risen in fifteen of those years.
The first day of May trades higher frequently, but DJIA has been down three of the last six first-trading days. Weakness often appears on the third, fourth, fourteenth and sixteenth trading days for large cap stocks. Mid-month strength has been fading recently. NASDAQ and the Russell 2000 take the lead the last three days of May.
| May (1950-2016) |
| |
DJI |
SP500 |
NASDAQ |
Russell
1K |
Russell 2K |
| Rank |
|
9 |
|
8 |
|
5 |
|
6 |
|
6 |
| #
Up |
|
35 |
|
39 |
|
28 |
|
26 |
|
25 |
| #
Down |
|
32 |
|
28 |
|
18 |
|
12 |
|
13 |
| Average
% |
|
-0.02 |
|
0.2 |
|
0.9 |
|
1.0 |
|
1.4 |
| 4-Year Presidential Election Cycle Performance
by % |
| Post-Election |
|
1.3 |
|
1.7 |
|
3.4 |
|
3.2 |
|
4.6 |
| Mid-Term |
|
-0.7 |
|
-0.9 |
|
-1.2 |
|
-0.1 |
|
-1.9 |
| Pre-Election |
|
0.1 |
|
0.2 |
|
1.9 |
|
1.2 |
|
2.7 |
| Election |
|
-0.7 |
|
-0.1 |
|
-0.3 |
|
-0.3 |
|
0.1 |
| Best & Worst May by % |
| Best |
1990 |
8.3 |
1990 |
9.2 |
1997 |
11.1 |
1990 |
8.9 |
1997 |
11.0 |
| Worst |
2010 |
-7.9 |
1962 |
-8.6 |
2000 |
-11.9 |
2010 |
-8.1 |
2010 |
-7.7 |
| May Weeks by % |
| Best |
5/29/70 |
5.8 |
5/2/97 |
6.2 |
5/17/02 |
8.8 |
5/2/97 |
6.4 |
5/14/10 |
6.3 |
| Worst |
5/25/62 |
-6.0 |
5/25/62 |
-6.8 |
5/7/2010 |
-8.0 |
5/7/10 |
-6.6 |
5/7/10 |
-8.9 |
| May Days by % |
| Best |
5/27/70 |
5.1 |
5/27/70 |
5.0 |
5/30/00 |
7.9 |
5/10/10 |
4.4 |
5/10/10 |
5.6 |
| Worst |
5/28/62 |
-5.7 |
5/28/62 |
-6.7 |
5/23/00 |
-5.9 |
50/20/10 |
-3.9 |
5/20/10 |
-5.1 |
| First Trading Day of Expiration Week: 1990-2016 |
| #Up-#Down |
|
20-7 |
|
20-7 |
|
17-10 |
|
19-8 |
|
15-12 |
| Streak |
|
U1 |
|
U1 |
|
U1 |
|
U1 |
|
U3 |
| Avg
% |
|
0.4 |
|
0.4 |
|
0.4 |
|
0.3 |
|
0.2 |
| Options Expiration Day: 1990-2016 |
| #Up-#Down |
|
13-14 |
|
14-13 |
|
13-14 |
|
14-13 |
|
12-15 |
| Streak |
|
U4 |
|
U4 |
|
U1 |
|
U4 |
|
U1 |
| Avg
% |
|
-0.1 |
|
-0.2 |
|
-0.1 |
|
-0.1 |
|
0.001 |
| Options Expiration Week: 1990-2016 |
| #Up-#Down |
|
15-12 |
|
15-12 |
|
16-11 |
|
14-13 |
|
16-11 |
| Streak |
|
D1 |
|
U2 |
|
U4 |
|
U2 |
|
U2 |
| Avg
% |
|
0.3 |
|
0.2 |
|
0.4 |
|
0.2 |
|
-0.1 |
| Week After Options Expiration: 1990-2016 |
| #Up-#Down |
|
15-12 |
|
17-10 |
|
18-9 |
|
17-10 |
|
21-6 |
| Streak |
|
U1 |
|
U3 |
|
U3 |
|
U3 |
|
U3 |
| Avg
% |
|
-0.1 |
|
0.2 |
|
0.4 |
|
0.2 |
|
0.5 |
| May 2017 Bullish Days: Data 1996-2016 |
| |
1,
2, 8, 10, 30 |
1,
30 |
1,
8, 17, 26, 30 |
1,
30 |
1, 2, 26, 30 |
| |
|
|
|
|
|
| May 2017 Bearish Days: Data 1996-2016 |
| |
3,
4, 18, 22, 23 |
3,
4, 18, 22 |
18 |
3,
4, 18 |
12 |
| |
|
|
|
|
|
|
May 2017 Strategy Calendar
|
|
By:
Christopher Mistal
|
April 25, 2017
|
|
|
|
|
Seasonal MACD Update & Late-April S&P 500 Rally
|
|
By:
Christopher Mistal
|
April 20, 2017
|
|
|
|
As of the today’s close, the faster moving MACD “Buy” applied to DJIA and S&P 500 was still negative. The MACD “Buy” indicator applied to S&P 500 will be positive with any gain tomorrow and would also turn positive as long as S&P 500 does not decline more than 11.36 points (–0.48%). DJIA’s MACD Buy indicator will be positive tomorrow with a gain of at least 6.86 points (0.03%).
Continue to hold long positions associated with DJIA’s and S&P 500’s “Best Six Months.” We will issue our Seasonal MACD Sell signal when corresponding MACD Sell indicators applied to DJIA and S&P 500 both crossover and issue a new sell.
Late April Long S&P 500 Trade
The best six months for owning stocks can begin in October or early November and usually lasts until April or early May for DJIA and S&P 500. However, seasonal strength for technology stocks, measured by NASDAQ, tends to last until June (“Best Eight Months”, see page 60 Stock Trader’s Almanac 2017). Due to its substantial weighting in technology, the S&P 500 also demonstrates a tendency to rally from late April until early June.
![[S&P 500 (SP) Continuous Contract Daily Bar Chart & 1-Yr Seasonal Pattern]](/UploadedImage/AIN_0517_20170420_SP_Seasonal.jpg)
This trade has been profitable 62.9% of the time over the longer-term however; its recent track record has been rough, declining seven times in the last eleven years. Going long the September futures contract on or about April 27 and holding until on or about June 7 has worked 23 times in 35 years. The key to this trade is overall market trend and proper trade management as numerous sizable losses and gains have occurred over the trade’s history. This is a shorter-term trade, for nimble traders, and is not related to our Seasonal Switching Strategy. Recent weakness has set this trade up for a potential win this year. In the S&P 500 chart at the beginning of this Alert, you can see that monthly support (green dashed line indicated by upper blue arrow) has held and today’s gains have turned the Stochastic indicator positive and moved both MACDs very close to turning positive.
![[S&P 500 September Futures Contract – Trade History]](/UploadedImage/AIN_0517_20170420_SP_History.jpg)
There are several ways to take advantage of this Spring rally. One is through the futures markets traded at the CME. Stock traders may wish to explore trading SPDR S&P 500 (SPY), which allows one to use options. The length of time this seasonality is in play makes leveraged ETFs like ProShares Ultra S&P500 (SSO) worth consideration as well. SSO could be considered on dips below $84.30. If purchased, an initial stop loss of $82.40 is suggested. This is just below SSO’s recent intra-day low of $82.48 on April 13. If purchased, we will look to take profits when SSO trades above $87 or when we issue our Seasonal MACD Sell signal. This trade will be tracked in the Almanac Investor ETF Portfolio, updated below.
ETF Portfolio Update
Put bluntly, April 2017 has been a dud for the market, at least prior to today. Historically, April has a
sound reputation for gains. It’s the first month of a new quarter, the last month of the “Best Six Months” and generally the market rallies in response to earnings. This April the market has been held in check by some mixed data and earnings, the Fed and its desire to tighten monetary policy and a seemingly endless list of geopolitical and domestic concerns. Quite a “wall of worry” has been constructed to impede the market’s progress. But, the market appears to be ready to begin climbing that wall once again with solid across the board gains today.
In the time since last update iShares 20+ Year Bond (TLT) short trade has been stopped out. It was covered using its average price of $123.94 on April 19, the day after it closed above its stop of $124.25. DB Gold Double Short (DZZ) was closed out of the portfolio today when it traded above $6.00.
Although erroneously overlooked during the last update,
CurrencyShares British Pound (FXB) long trade from our
March 7, 2017 Seasonal Sector Trades Alert now appears in the portfolio table below. The main driver for this seasonal trade, the end of Britain’s fiscal year, was aided by Brexit concerns this time around and FXB is currently up 5.1%. The favorable seasonality behind this trade typically comes to an end now, but recent strength by the pound has traced out bullish a 1-2-3, “W” bottom pattern when FXB closed above its December high earlier this week. Instead of outright selling
FXB is on Hold and its stop loss has been increased to $124.50. This should give FXB an opportunity to see if the breakout can hold and deliver further gains.
All long positions remain on hold. Please see table below for updated stop losses and current advice.
Disclosure Note: At press time, officers of the Hirsch Organization, or accounts they control held positions in FXB, IWM, IYT, QQQ, SPY, VNQ, XLB, XLE, XLP, XLV and XLY.
|
Seasonal MACD Update: Market Struggling to Gain Traction
|
|
By:
Jeffrey A. Hirsch & Christopher Mistal
|
April 18, 2017
|
|
|
|
So far this year, Wednesday is the best performing day of the week for S&P 500, advancing 11 out of 15 times. We do not apply a great deal of weight to this accomplishment as research in the Stock Trader’s Almanac (STA) has repeatedly demonstrated that the beginning and ends of days, weeks, months and years tend to hold greater significance and Wednesday is nearly always the third trading day of the week, unless Monday was a holiday.
On page 143 of STA 2017 the 23 bears years – 1953, ’56, ’57, ’60, ’62, ’66, ’69, ’70, ’73, ’74, ’77, ’78, ’81, ’84, ’87, ’90, ’94, 2000, 2001, 2002, 2008, 2011 and 2015 are separated from 42 bull market years. [
Editor’s note: Ned Davis definitions of bull and bear market are used in the Almanac. A cyclical bull market requires a 30% rise in the DJIA after 50 calendar days or a 13% rise after 155 calendar days. Reversals of 30% in the Value Line Geometric Index since 1965 also qualify. A cyclical bear market requires a 30% drop in the DJIA after 50 calendar days or a 13% decline after 145 calendar days. Reversals in the Value Line Geometric Index also qualify. Bull and bear markets are measured at peak and trough dates, so both the time and price criteria must be met as of the peak and trough dates. Using this criterion, the majority of 2015 was a bear market.]
While Tuesday and Thursday did not vary much between bull and bear years, Mondays and Fridays were sharply affected. There was a swing of 10.1 percentage points in Monday’s and 9.5 in Friday’s performance. When traders and investors are reluctant to hold positions over the weekend and fail to buy on the first trading day of the week, they are showing a lack of confidence. Since mid-March, Fridays (or the last trading day of week) have been poor, and Mondays (or first trading day of the week) have been weak. Improving market performance on Fridays and Mondays would confirm this bull still has legs while the opposite would suggest a rising probability of trouble ahead.
Seasonal MACD Update
As of the today’s close, both the faster moving MACD “Buy” and slower moving MACD “Sell” indicators (at bottom of following charts where blue arrows point) applied to DJIA and S&P 500 were negative, but still trending toward reversing the sell signal that has been on the charts since early March. DJIA’s MACD Buy indicator would turn positive with a one-day gain exceeding 115.27 points (0.56%) and S&P 500 MACD Buy would be positive with a 16.00 point or greater gain (0.68%).
Continue to hold long positions associated with DJIA’s and S&P 500’s “Best Six Months.” We will issue our Seasonal MACD Sell signal when corresponding MACD Sell indicators applied to DJIA and S&P 500 both crossover and issue a new sell.
3PDH – In Play
Our old esoteric chart pattern friend, the Three Peaks and a Domed House Top pattern (3PDH), is potentially in play again. Below is our latest plotting of this arcane yet uncannily accurate chart pattern as it currently may be playing out on the S&P 500. But first a brief profile on the 3PDH.
The Three Peaks and a Domed House pattern was developed back in 1968 by the late, great technician George Lindsay, really a technical analysis savant genius. Lindsay’s research found that the market followed this pattern “at least 60% of the time” and that “the majority of all major advances ended in a pattern which resembled the Three Peaks and a Domed House.” This recurring market pattern occurs at nearly every major U.S. equity market top and articulates consistent market behavior.
The 3PDH chart pattern demonstrates how markets tend to come off a low and move up until a resistance point is reached (point 3). Then after two attempts to move higher (points 5 and 7) there is a sell-off to point 10. This is the “Separating Decline” that separates the Three Peaks from the Domed House. Point 10 is always lower than either point 4 or 6, often both. If is not lower it does not qualify and the pattern is nullified. The Domed House starts with a base between points 10 and 14. A rally usually ensues and forms another higher base (points 15 to 20, Roof of the First Story). Then from there the final surge to the high creates the Dome from points 21 to 25. The drop-off returns to the vicinity of point 10.
![[Basic Model CHART]](/UploadedImage/3PeaksDomedHouseBasicModel.jpg)
Minor and major formations of Three Peaks and a Domed House often overlapped with a Peak of one being a Dome of another. Sometimes Three Peaks followed a Domed House. Some tops could not be fit into the pattern and do not qualify. In some instances points 25 or 27 were higher than the point 23 Domed House Top.
Correlating the current chart of the S&P 500 with the Basic Model above, the recent high on March 1 could be point 21 or even point 23. In either case a bounce slightly higher to a point 23 Domed House Top or even at point 25 or 27 seems likely given the historical seasonal prowess of the month of April and the propensity for markets to lose steam in May as well as the current technical setup for an oversold bounce.
We have added a few key major support levels or levels any major correction or bear market could bring the S&P back to at: the November 2016 Election Low ~2085, the Brexit Low ~2000, the Point 10 Low ~1865 and big round 1800 below them all. We do not expect the 20%+ bear this year – though that could change if things deteriorate.
It is more likely in our view that after a bounce higher over the next month or so into the 2400-2450 range in early-mid May. Then we could drop 8-15% into the area between the Election Low and the August/November highs, finishing 2017 around 2425, up around 8% for the year (as forecasted) and be in a longer bear that does not finish until midterm 2018 peak to trough.
|
Mid-Month Update: Recent Struggles Setting Up a Bounce
|
|
By:
Christopher Mistal & Jeffrey A. Hirsch
|
April 13, 2017
|
|
|
|
Essentially at the half-way point of April, the month has been a disappointment thus far. As of the close today, DJIA is down 1.0%, S&P 500 is off 1.4%, NASDAQ has slipped 1.8% and Russell 2000 is lower by 2.9% so far this April. Geopolitical tensions have heightened, ambitious goals of the new administration have been stymied and the fact that the Federal government is set to run out of funding at the end of month are tempering confidence in the economy and the market.
Economic data has also weakened recently. March’s jobs report was softer than expected with just 98,000 net new jobs. Although the unemployment rate still declined 0.2% to 4.5% in March. Due to a significant drop in the labor force participation rate, initial weekly unemployment claims continue to hover around multi-decade lows. Absent a steady pickup in weekly claims, the data would suggest the labor market is reasonably healthy, but it could be better.
Atlanta Fed’s GDPNow real GDP forecast for the first quarter of 2017 is a paltry 0.6% as of April 7. Even though the Fed would prefer to have some additional leeway to combat any future economic weakness, it may need to reconsider its current projected pace of rate increases as 0.6% is not runaway growth or does it indicate inflation is going to become an urgent issue anytime soon.
Big bank earnings were broadly upbeat. JPMorgan, Citigroup and PNC all beat. Wells Fargo beat on the bottom line, but missed on revenue. Based upon the market’s reaction today, expectations may have been higher or today was just a good day to take profits. Considering the magnitude of gains enjoyed by many bank stocks since Election Day, some profit taking is reasonable.
Next week is options expiration week. The week also hosts a bullish cluster of
five consecutive bullish S&P 500 days. April option expiration is generally bullish across the board with solid gains on the last day of the week, the entire week and the week after. Since 1982, DJIA and S&P 500 have both advanced 23 times in 35 years on expiration day with an average gain of just under 0.2%. Both the S&P 500 and DJIA have been up seven of the past eleven expiration days. Expiration week as a whole has a slightly more bullish track record over the past 35 years to expiration day. Average weekly gains are 1% or better for S&P 500, DJIA and NASDAQ. The bullish bias of April expiration also persists during the week after. DJIA has posted a full-week gain in eleven of the last thirteen weeks following expiration.
![[DJIA Options Expiration Table]](/UploadedImage/AIN_0517_20170413_Options_DJIA.jpg)
![[S&P 500 Options Expiration Table]](/UploadedImage/AIN_0517_20170413_Options_SP500.jpg)
![[NASDAQ Options Expiration Table]](/UploadedImage/AIN_0517_20170413_Options_NASDAQ.jpg)
In addition to the bullish options expiration seasonality next week, technical indicators applied to DJIA, S&P 500 and NASDAQ are also setting up for a potential bounce. Faster and slower moving MACD indicators applied to DJIA and S&P 500 could quickly turn positive after being negative since early March. Relative strength indicators applied to DJIA and S&P 500 are dipping into oversold territory. Support at their respective 50-day moving averages may not have held, but monthly pivot point support could hold. Those levels are right around DJIA 20330 and S&P 500 2323.
Although Wall Street and Washington have been jittery lately the market continues to track our
Base Case Annual Forecast which we gave odds of 65% last December when we released it. Our analysis was that President Trump would not be able to achieve much and that there would be little change. And as we are seeing quite dramatically this week Trump would be forced to resort to a lot of compromise while lukewarm economic activity persisted, keeping 2017 market gains in the single digit to low double digit area. And that is precisely where we are at with DJIA up 3.5% year-to-date, S&P up 4.0%, NASDAQ up 7.8% and Russell 2000 off a fractional 0.1%.
Perhaps all the Republican squabbling and Democratic grandstanding will create that type of gridlock that the market thrives on where Washington does little to interfere with the private sector. The current geopolitical and domestic policy obstacle, especially the looming government shutdown if Congress does not get the government funded by month end, are likely to continue to put downside pressure on stocks.
But we believe that downside move will be limited to a 5-15% summer/fall correction. For now though we are still bullish and expect another leg up. Continue to hold long positions associated with DJIA’s and S&P 500’s “Best Six Months.” We will issue our Seasonal MACD Sell signal when corresponding MACD Sell indicators applied to DJIA and S&P 500 both crossover and issue a new sell.
|
Stock Portfolio & Seasonal MACD Updates: Still On Hold
|
|
By:
Christopher Mistal
|
April 11, 2017
|
|
|
|
As of the yesterday’s close, both the faster moving MACD “Buy” and slower moving MACD “Sell” indicators (at bottom of following charts) applied to DJIA and S&P 500 were negative, but still trending toward reversing the sell signal that has been on the charts since early March. Although DJIA recorded a modest decline today, it’s faster moving MACD “Buy” indicator turned positive today. S&P 500’s faster moving MACD “Buy” indicator would turn positive with a 5.52 point gain tomorrow.
Continue to hold long positions associated with DJIA’s and S&P 500’s “Best Six Months.” We will issue our Seasonal MACD Sell signal when corresponding MACD Sell indicators applied to DJIA and S&P 500 both crossover and issue a new sell.
Portfolio Updates
In the four and a half weeks since last update, S&P 500 was 0.2% lower while Russell 2000 was up 0.1% as of yesterday’s close. The Almanac Investor Stock Portfolio’s blend of cash and long positions resulted in a 0.4% overall gain over the same time period. Our Large-Cap portfolio performed best, up 1.3%. Small-Caps were second best, gaining 0.4% while Mid-Caps slipped 0.2% (the only red blemish in the entire portfolio.
Almanac Investor Large-Caps were supported by a 7.9% gain by Arista Networks (ANET). Shares of ANET traded at new all-time highs as recently as last Thursday, April 6. Although there has been little response in share price yet, this weekend’s favorable announcement from U.S. Customs (can once again import finished product into the U.S.) is expected to have a positive impact on this quarter’s earnings. ANET is on Hold.
Bright spots in the Mid-Cap portfolio include Scotts Miracle-Gro (SMG) and Sabra Healthcare REIT (SBRA). Both enjoyed solid gains over the last month, but their strength was insufficient to overcome weakness in Ameris Bancorp (ABCB) and Western Alliance (WAL). Seasonal weakness in bank stocks may be beginning early this year. Based upon the KBW NASDAQ Bank Index (BKX), the sector generally enjoys strength until the beginning of May (page 94 STA 17). The associated trade in the ETF Portfolio, SPDR Financials (XLF) was closed out at its auto-sell price of $23.53 back in early December for a 23.5% gain. The sector has been essentially flat since then and XLF is currently trading just under our December exit price.
Once again this update, the Small-Cap portion of the portfolio owes much of its performance to Pressure Biosciences (PBIO). Last update, it appeared PBIO had adequate momentum to carry it to a double and beyond. PBIO traded above $0.32 for the first time on March 31, triggering standard trading guidelines of selling half the position when it doubles. It has since traded above 0.32 during four of the last seven trading sessions. PBIO is on Hold.
The Hersey Company (HSY) and Rocky Mountain Chocolate Factory (RMCF) have been treading water over the last four weeks. Falling and/or lower cocoa prices is the underlying basis for being long HSY and RMCF. When the trade was presented in early March, cocoa was in a relentless downtrend, but it did bounce during the second half of March. That bounce appears to have been short-lived and cocoa has rolled over once again. HSY and RMCF are both on Hold.
All other positions, not mentioned above, are currently on Hold. Please refer to the updated portfolio table below for Current Advice about each specific position. Please note that some stop losses have been updated as a result of recent moves.
Disclosure Note: At press time, officers of the Hirsch Organization, or accounts they control held positions in ANET, BUSE, CCS, IESC, MHO and SBRA.
|
Seasonal MACD Update & Seasonal Sector Trades: 30-year Treasury Bond
|
|
By:
Christopher Mistal & Jeffrey A. Hirsch
|
April 06, 2017
|
|
|
|
As of the today’s close, both the faster moving MACD “Buy” and slower moving MACD “Sell” indicators (at bottom of following charts) applied to DJIA and S&P 500 were negative and trending toward reversing the sell signal that has been on the charts since early March.
Continue to hold long positions associated with DJIA’s and S&P 500’s “Best Six Months.” We will continue to monitor the fundamental and technical outlook and issue our Seasonal MACD Sell signal when corresponding MACD Sell indicators applied to DJIA and S&P 500 both crossover and issue a new sell again.
30-year Treasury Bond Late-April Rally
The long bond tends to bottom sometime during Q2, typically around the time the stock market reaches its highs, and then enjoys a solid run of strength into Q3 and beyond in some years. Note seasonal strength shaded in yellow in chart below. Bonds are also a relatively safe place to park capital during the “Worst Six Months” of the year, May through October.
Featured in Commodity Trader’s Almanac 2013 (2018 edition is in discussion), when investors feel threatened with a potential decline in the stock market, they often allocate more money into bonds. This is often referred to as the “flight to safety” trade. Investors and traders will also allocate more money to bonds when they believe the yield is more attractive than other shorter-term investment options.
There is no doubt that both of those conditions were met in late 2008 through early 2009. However, even in that unprecedented time, 30-year bond price action did respect a seasonal supply-demand cycle. By going long, the September 30-year Treasury bond on or about April 27, and exiting the position on or about August 21, we discovered in the last 39 years a respectable 69.2% success rate. This trade has a history of 27 wins with 12 losses; the largest win was $20,250 in 2011, and the largest loss was $17,031 in 2013. The trade’s track record over the last 28 years (shaded in grey in table below) is even better with 21 gains and a success rate of 75.0%.
Although the specter of additional Fed interest rate hikes loom large, this trade will likely still perform this year as our bond yields remain attractive to foreign buyers. Our 30-year Treasury bond yielding around 3.0% does compare quite favorable to Germany’s 1.03% or Japan’s 0.83%. Growth and inflation expectations also remain on the tepid side so even if short-term rates increase due to Fed action, long-term rates may not necessarily rise. Brexit concerns and a pending showdown over the debt ceiling could also trigger a flight to safety.
Stock traders may consider the exchange-traded fund, iShares 20+ Year Bond (TLT), as a replacement for the futures contract. TLT has a little more than $6 billion in assets, typically trades more than 3 million shares per day and has a reasonably deep and liquid options chain available. TLT’s expense ratio of just 0.15% is very reasonable and its current yield just under 3% is also an attractive.
Stochastic, MACD and relative strength indicators applied to TLT had improved substantially since mid-March, but have begun to turn less positive. Should equity markets strengthen as they usually do in April,
TLT would be attractive on dips below $117.65. If TLT trades below this buy limit, the
existing short position held in the ETF Portfolio will be covered. Alternatively, TLT trade execution could be postponed until
when we issue our MACD Seasonal Sell Signal Alert.
|
ETF Trades & Seasonal MACD Update: On Hold for Now
|
|
By:
Christopher Mistal
|
April 04, 2017
|
|
|
|
At the start of March we updated the S&P 500 Performance during the First 100 Days of new administrations since 1953 in a post titled “
February Weakness Avoided, March’s Thunder Stolen?” Looking at the same chart updated through today’s close, March was indeed a dud. Instead of a respectable rally, S&P 500 fell 0.04% in March. As of today’s close it has been 75 calendar days since President Trump took office and S&P 500 has gained 3.9% which is still above historical average. Historically, March was a flat month for new Republican administrations (solid red line in chart below), but that weakness ended on average in early April and the S&P 500 rallied nearly 4% by the end of the month (black arrow). A similar result this year would put S&P 500 off this chart by the end of the month.
Seasonal MACD Update
As of the close yesterday, both the faster moving MACD “Buy” and slower moving MACD “Sell” indicators (at bottom of following charts) applied to DJIA and S&P 500 were negative, but were trending toward reversing the sell signal that has been on the charts since early March.
Continue to hold long positions associated with DJIA’s and S&P 500’s “Best Six Months.” We will continue to monitor the fundamental and technical outlook and issue our Seasonal MACD Sell signal when corresponding MACD Sell indicators applied to DJIA and S&P 500 both crossover and issue a new sell again.
May Sector Seasonalities
Three sectors begin seasonally weak periods in May: Banking, Gold & Silver (stocks) and Materials. Over the past 15 years, all three sectors have declined on average 6.3 to 7.5% which sets them up as a reasonably good short trade candidates during the spring and early summer months. Although not published in the Stock Trader’s Almanac 2017 on page 94, Transports also exhibit seasonal weakness from early May through late June with an average loss of 5.5% over the past 15 years.
Typically we like to take advantage of sector weakness through the use of inverse or bearish ETFs. By doing so, the trade is similar to any other long trade that we choose to execute. One of the drawbacks of inverse ETFs is they frequently employ leverage and only track the daily performance of the underlying benchmark. As holding periods get longer, these types of funds often exhibit performance that differs significantly from the underlying security or index’s performance due to compounding and tracking errors. Three out of today’s four new trade ideas are going to be short trades. An “(S)” follows each ETF name in the portfolio table to denote it is a short trade. Only in the case of Gold & Silver will we use a leveraged inverse fund as its seasonally weak period is only about six weeks long.
Because there are already corresponding long positions in transports and materials sectors already in the portfolio, we will look to short these two sectors at resistance or when we issue our Seasonal MACD Sell Signal Alert. If a short trade in materials or transports hits its execution price before our Seasonal MACD Sell Signal, the corresponding long position could be sold and the short position implemented.
![[SPDR Financial (XLF) Daily Bar Chart]](/UploadedImage/AIN_0517_20170404_XLF.jpg)
SPDR Financial (XLF) could be shorted just above resistance at $25.25. After gapping higher to start March, XLF has been under pressure since. It has slipped below its 50-day moving average and Stochastic, relative strength and MACD are all weak. However, Q1 earnings reports do have the potential to trigger a bounce higher. If shorted, set an initial stop loss at $27.78. Rising interest rates and a steepening yield curve were expected to lift banks’ profits, but the Fed appears to be on a prolonged and steady tightening cycle that is actually starting to flatten the yield curve as growth and inflation expectations are keeping the long end of the Treasury yield curve well anchored.
![[iShares DJ Transports (IYT) Daily Bar Chart]](/UploadedImage/AIN_0517_20170404_IYT.jpg)
iShares DJ Transports (IYT) could be shorted on a rally toward resistance around $173.45. Stochastic, MACD and relative strength are currently mixed. Relative strength is neutral; Stochastics were improving, but have since triggered sell while MACD is slightly positive. IYT could easily bounce or just fall apart. Crude oil’s price could provide an early indication of which way it may be. The initial stop loss is $190.80. Tepid U.S. and global growth is still an issue the sector must overcome.
Direxion Daily Jr Gold Miners Bear 3X (JDST) can be bought on dips below $12.00. JDST is volatile due to its 3x leverage and frequently trades in a wide daily range. If purchased set an initial stop loss at $10.50. Consider taking profits on any jump above $15.00.
SPDR Materials (XLB) could be shorted on a rally back toward resistance near $53.45. XLB had enjoyed a solid rally from Election Day until early March. Since then, it has been sideways and it’s Stochastic, MACD and relative strength indicators are mixed. Stochastic indicator is on sell, relative strength is showing a modest improvement and MACD is also signaling a buy. Depending upon where the broad market goes next and where growth expectations go, XLB could creep higher or breakdown and test its 200-day moving average. A stop loss at $58.80 is suggested.
ETF Portfolio Updates
When compared to January and February, March was a challenging month for many sectors and major indices. DJIA, S&P 500 and Russell 2000 all finished March with mild losses while NASDAQ advanced 1.5%. This pattern is prevalent throughout the ETF Portfolio. Technology-related positions such as IYW, XLK and QQQ enjoyed modest gains while most other positions held suffered mild declines.
During March, weakness across precious metals, base metals and energy had mixed results on the portfolio. Silver price declines were sufficient to lift ProShares UltraShort Silver (ZSL) above its auto-sell price of $33.00 on March 9. ZSL was sold then for a quick 10% gain. DB Gold Double Short (DZZ) did rally early month, but gold’s decline was modest and DZZ did not reach its auto-sell and has since retreated and has a modest 0.7% loss. DZZ can be sold on any rally back above $6.00. Weakness in copper in March translated into a pullback by copper miners and Global X Copper Miners (COPX) was stopped out on March 7 when it closed below its stop of $22.63. COPX was closed out of the portfolio using its average trading price on the next day.
April is generally a top performing month of the year. It has been up 11 straight years in a row and its performance remains solid in post-election years. It is the first month of a quarter and it also hosts the first earnings announcements for the New Year. But, it is also the last month of the “Best Six Months” for DJIA and S&P 500. With this in mind, we maintain a long bias in the ETF Portfolio with a mindful eye on fundamentals and technical indicators for sign of weakness. When we issue our Seasonal MACD Sell Signal Alert, we will reduce long exposure and look to execute the best setup short-trade ideas at that time. Until then, all long positions remain on hold. Please see table below for updated stop losses and current advice.
Disclosure Note: At press time, officers of the Hirsch Organization, or accounts they control held positions in IWM, IYT, QQQ, SPY, VNQ, XLB, XLP, XLV and XLY.