|
Market at a Glance - 11/23/2021
|
|
By:
Christopher Mistal
|
November 23, 2021
|
|
|
|
Seasonal: Bullish. December is the 3# month for DJIA, S&P 500 and NASDAQ. It is also the second month of the “Best Months” and best three consecutive month span. Performance is modestly softer in post-election years. Wall Street’s only Free Lunch will be served prior to the open on December 20. Santa Claus Rally begins on the open on December 27 and runs until the close on the second trading day in January.
Fundamental: Mixed. According to the Atlanta Fed’s GDPNow model, Q4 growth is forecast at 8.2% as of its most recent update on November 17. However, inflation is running at multi-decade highs and covid-19 cases are trending higher which could pull activity lower. Q3 corporate earnings have largely been a homerun but comparisons will begin to get tougher. October’s jobs report was solid, but a sizable chunk of the gains may have been temporary holiday-related positions that may not last.
Technical: Consolidating. After breaking out to new all-time highs in early November, DJIA and Russell 2000 have retreated. S&P 500 and NASDAQ have fared better with both reaching new highs last week prior to this week’s retreat. All four indexes remain above their respective 50-day moving averages, but DJIA and Russell 2000 are closer. For the rally to resume in earnest, DJIA and Russell 2000 need to find support. Key levels to watch appear to be DJIA 35600 and Russell 2000 at 2300. A meaningful breech of these levels could weigh heavily on S&P 500 and NASDAQ.
Monetary: 0 – 0.25%. At its regularly scheduled meeting at the start of November the Fed did as was widely anticipated, it announced that bond purchases would be tapered. They announced hard numbers for November and December but left subsequent monthly adjustments open and data dependent. Fed Chairman Powell will remain which, depending on how you view the Chairman may be a blessing or a curse. At a bare minimum his reappointment does rule out the uncertainty of someone new taking his place. Overall, even with the reduction in bond purchases, Fed policy remains highly supportive and bullish for stocks at this time.
Psychological: Near Frothy. According to
Investor’s Intelligence Advisors Sentiment survey Bullish advisors have jumped to 57.2%. Correction advisors have retreated to 21.4% while Bearish advisors stand at 21.4% as of the November 17 release. The jump in bullish sentiment was supported by a breakout to new all-time highs and perhaps an early sampling of holiday spirit. With the rally stalling, sentiment may have eased over the last week. It is common for sentiment to remain elevated during the holiday season as it has typically been a bullish time for stocks.
|
December Outlook: New Highs Likely Before Yearend
|
|
By:
Jeffrey A. Hirsch & Christopher Mistal
|
November 23, 2021
|
|
|
|
YALE HIRSCH (1923-2021)
It is with great sadness that we inform you that our beloved founder, Yale Hirsch, creator of the Stock Trader’s Almanac passed away earlier this month after an amazing 98-year run. He was a Wall Street legend and iconic thinker who put market seasonality, cycles, trends and patterns in every investor’s and trader’s arsenal. Yale discovered the “January Barometer,” “Santa Claus Rally,” the “Best Six Months Switching Strategy” (beyond “Sell in May”), as well as many of the other seasonal and cyclical patterns we all rely on. We proudly stand on his ample analytical shoulders. Rest in peace Pop!
Seasonal patterns continue to reassert themselves and that is positive for new highs by yearend. Typical September and early October weakness created a solid set up for our
October 8 Seasonal MACD Buy Signal. Then late-October seasonal strength carried into early November before the usual pre-Thanksgiving weakness ensued. As we head into the holiday the market seems to be finding its footing and we look for the market to shake off its current funk as it usually does and rally into the Black Friday shopping spirt.
As the S&P 500 is up rather impressively, 24.9% year-to-date this year through today’s close on the Tuesday before Thanksgiving, we ran the numbers on the 33 previous years with double digit year-to-date gains at this juncture since 1950. There are a few blemishes, but in general market gains continued into yearend.
Most importantly, there are no major selloffs on this list. The big December decline of -9.2% in 2018 came after the S&P 500 was down -1.2% at this point in the year. After double-digit YTD gains the S&P 500 was up 70% of the time from the Tuesday before Thanksgiving to yearend for an average gain of 2.3%.
Also of note is that the Santa Claus Rally suffered only four losses in these years. But these four down SCRs in 1955, 1968, 1999 and 2014 were followed by flat years in 1956 and 2015 and down years in 1969 and 2000. As Yale’s famous line states (2021 Almanac page 116 and 2022 Almanac page 118): “If Santa Claus Should Fail To Call, Bears May Come to Broad and Wall.”
December typically starts out weak as tax-loss selling ramps up and with the big gains this year we would expect that early December weakness to materialize. Then as you can see in the typical December chart here stocks begin to takeoff around mid-month led by small caps and the Russell 2000.
This is what used to be known as the “January Effect:” small caps outperforming large caps in the month of January. Nowadays most of the so-called January Effect takes place in the last half of December (2021 Almanac pages 110 & 112, 2022 pages 112 & 114). The January Effect is not to be confused with the January Barometer (2021 Almanac page 16, 2022 page 18), which states as the S&P 500 goes in January, so goes the year.
After mid-December we serve up our “Free Lunch” stock picks from the lists of stocks making new 52-week lows on December Triple-Witching Friday which lands on December 17 this year and present the basket to subscribers over the weekend before the open the following Monday (see 2021 Almanac page 114, 2022 page 116). This strategy is built to capitalize on the January Effect and the Santa Claus Rally.
The Santa Claus Rally was defined by Yale Hirsch in 1972 as the last five trading days of the year and the first two trading days of the New Year. This short, sweet rally is usually good for about 1.3% on the S&P 500, but as we alluded to before the real significance of the SCR is as an indicator.
It is our first seasonal indicator of the year ahead. Years when there was no Santa Claus Rally tended to precede bear markets or times when stocks hit significantly lower prices later in the year. We get an even better indication of the New Year when we combine SCR with the First Five Days Early Warning System (2021 Almanac page 14, 2022 page 16) and the full-month January Barometer reading. We call this the “January Indicator Trifecta.”
When all three are up the S&P 500 has been up 90% of the time, 28 of 31 years, with an average gain of 17.5%. When any of them are down the year’s results are reduced and when all three are down the S&P was down 3 of 8 years with an average loss of -3.6% with bear markets in 1969 (-11.4%), 2000 (10.1%) and 2008 (-38.5%), flat years in 1956 (2.6%), 1978 (1.1%) and 2005 (3.0%). Down Trifecta’s were followed by gains in in 1982 (14.8%) and 2016 (9.5%).
Our outlook remains bullish for the remainder of 2021 and as long as Covid cases don’t explode again and many places go on lockdown or ramp up restrictions majorly, new highs are likely before yearend and we would not be surprised to see the S&P 500 encroach upon the big round number of 5000. 2022 will likely be a different case and we will address that thoroughly in our 2022 Annual Forecast next month.
Pulse of the Market
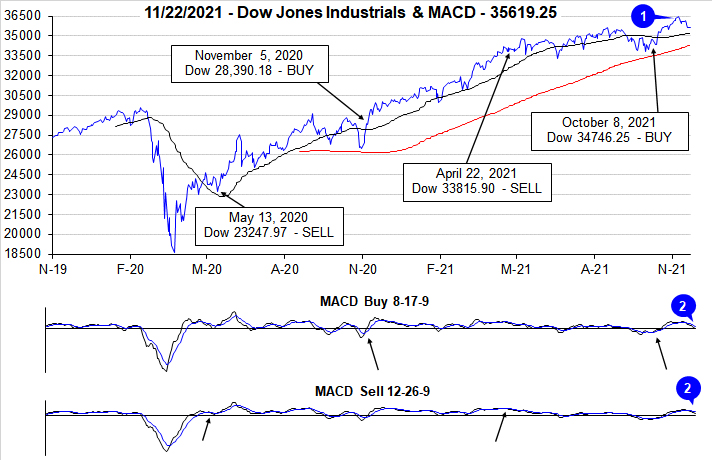
Momentum from October’s strong rally continued into early November and propelled DJIA to new all-time closing highs just below the upper boundary of our chart at 36,500 (1). At its closing high on November 8, DJIA was a mere 6.55% from our projected Super Boom level of 38,820 first published in the 2010 Almanac. However, globally rising covid-19 cases and persistent inflation have since stalled DJIA’s rise. DJIA’s loss of positive momentum earlier this month is currently confirmed by faster and slower moving MACD indicators that are negative (2). This year’s mid-November weakness is consistent with the full month’s typical seasonal pattern over the past 21 years.
After five straight weeks of gains running from early October through early November, DJIA (3) has declined for two consecutive weeks. S&P 500 (4) and NASDAQ (5) followed a similar pattern except for last week. Once again it appears rising covid-19 cases buoyed technology stocks at the expense of industrials and other reopening sectors. This trend is likely to persist until case numbers show signs of plateauing.
Over the last four weeks, NYSE Weekly Advance/Decline metrics (6) have been largely as one would expect. In positive weeks Weekly Advancers outnumbered Weekly Decliners and vice versa in down weeks. Last week’s mixed performance where DJIA declined while S&P 500 and NASDAQ advanced would be the exception as NYSE Weekly Decliners outnumbered Weekly Advancers by around 2.4 to 1. This would seem to suggest more weakness hidden behind the weekly index gains. How the balance of this week unfolds may likely determine how the rest of November and December unfold. Should typical Thanksgiving strength materialize then a typical yearend rally seems most likely.
Weekly New Highs (7) appear to have peaked along with the major indexes earlier this month. Weekly New Lows have expanded as well. This is typical behavior for the bout of weakness the market is currently enduring. The magnitude of New Highs or New Lows has not reached levels that are consistent with a major market top or bottom. This would suggest current weakness is likely just a pause in the rally provided further deterioration does not unfold.
Even with seemingly steadfast inflation metrics, the 30-year Treasury bond yield (8) continues to linger on either side of 2% in a relatively narrow range. It would seem that the bond market believes inflation will be transitory and growth is also likely to be subpar over the long-term. The key here being long-term, on a three-decade time horizon. Hopefully it is correct when it comes to inflation, but incorrect when it comes to economic growth.
Click for larger graphic…
|
Stock Portfolio Updates: New Positions Advance Nicely
|
|
By:
Christopher Mistal
|
November 18, 2021
|
|
|
|
[Editors note: Due to Thanksgiving, the next email Alert will be sent out after the market closes on Tuesday, November 23.]
Following a strong open to the month, the major indexes we routinely track did pause and pullback modestly ahead of mid-month. Over the past week, S&P 500, NASDAQ and Russell 1000 have all traded higher with NASDAQ leading the way. However, DJIA and Russell 2000 have traded lower. This divergence is noteworthy as DJIA and Russell 2000 are the indexes that are actually most closely following the typical trading pattern observed in November over the last 21 years. This dip by DJIA and Russell 2000 may be all the weakness the market offers in advance of strength usually observed ahead of Thanksgiving and at the end of November.
Stock Portfolio Updates
Over the last three weeks since last update through yesterday’s close, S&P 500 climbed 3.0% higher while Russell 2000 advanced 5.5%. During the same time period the entire portfolio was up 2.1%, excluding dividends and any fees. The Mid-cap portion of the portfolio performed best, advancing 4.5%. Small caps were second best, up 2.1%. Large caps were essentially flat, off 0.02%.
Weakness in the Large-cap portfolio was primarily the result of its concentration in defensive, dividend paying positions that weakened as 10-year Treasury rates crept modestly higher. AT&T (T) and Verizon (VZ) declined further as both agreed to pause their C-Band 5G rollout due to concerns from the FAA while rival T-Mobile continued to expand its network which uses a different frequency spectrum. Considering C-Band 5G is already deployed in nearly 40 other countries where planes safely operate daily, and the pause was voluntary the selloff does appear excessive.
T and VZ can be considered near current levels up to their respective buy limits in the table below. For tracking purposes we will add to the existing T position using its average daily price on November 19. VZ was officially stopped out today. We will close the old position out in the next update and establish a new position using VZ’s average price on November 19.
Recently added Mid-cap positions, A10 Networks (ATEN), Green Brick Partners (GRBK) and Pacira Pharmaceutical (PCRX), have all advanced nicely since being added last month. ATEN is up 23.0% and GRBK is also up over 20%. Aaon Inc (AAON) and Encore Wire (WIRE) did not trade below their respective limits. WIRE has run away and appears to be overbought so we are going to cancel this trade idea. AAON has risen as well but remains attractive up to its new buy limit of $76.95.
Newly added Small-cap positions have also fared well led by a 25.3% gain by Sterling Construction (STRL). Entravision Communications (EVC), up 7.3%, as of yesterday’s close was as high as $9.34 last week. Both STRL and EVC are on Hold. Last update we elected to wait and see if USA Truck Inc (USAK) would pullback below it buy limit. That did not occur. Increase USAK Buy limit to $22.25. For tracking purposes, USAK will be added to the portfolio using its average daily price on November 18.
Please see table below for updated stop losses and current advice for each position.
|
December Almanac: Free Lunch & Awaiting Santa
|
|
By:
Jeffrey A. Hirsch & Christopher Mistal
|
November 18, 2021
|
|
|
|
December is the number three S&P 500 and Dow Jones Industrials month since 1950, averaging gains of 1.5% on each index. It’s the second-best Russell 2000 (1979) month and third best for NASDAQ (1971) and Russell 1000 (1979). In 2018, DJIA suffered its worst December performance since 1931 and its fourth worst December going all the way back to 1901. However, the market rarely falls precipitously in December and a repeat of 2018 is not all that likely. When December is down it is usually a turning point in the market—near a top or bottom. If the market has experienced fantastic gains leading up to December, stocks can pullback in the first half of the month.
In the last seventeen post-election years, December’s ranking slipped to #7 S&P 500, #7 NASDAQ and DJIA #5. Small caps, measured by the Russell 2000, tend to have a field day in post-election-year Decembers. Since 1981, the Russell 2000 has lost ground three times in ten post-election years in December. The average small cap gain in all ten years is a solid 2.2%.
Trading in December is holiday inspired and fueled by a buying bias throughout the month. However, the first part of the month tends to be weaker as tax-loss selling and yearend portfolio restructuring begins. Regardless, December is laden with market seasonality and important events.
Small caps tend to start to outperform larger caps near the middle of the month (early January Effect) and our “Free Lunch” strategy is served from the offerings of stocks making new 52-week lows on Triple-Witching Friday. An Almanac Investor Alert will be sent prior to the open on December 20 containing “Free Lunch” stock selections. The “Santa Claus Rally” begins on the open on December 27 and lasts until the second trading day of 2022. Average S&P 500 gains over this seven trading-day range since 1969 are a respectable 1.3%.
This is our first indicator for the market in the New Year. Years when the Santa Claus Rally (SCR) has failed to materialize are often flat or down. The last six times SCR (the last five trading days of the year and the first two trading days of the New Year) has not occurred were followed by three flat years (1994, 2004 and 2015) and two nasty bear markets (2000 and 2008) and a mild bear that ended in February 2016. As Yale Hirsch’s now famous line states, “If Santa Claus should fail to call, bears may come to Broad and Wall.”
December Triple Witching Week is more favorable to the S&P 500 with Monday up thirteen of the last twenty-one years while Triple-Witching Friday is up twenty-six of the last thirty-nine years with an average 0.24% gain. The entire week has logged gains twenty-eight times in the last thirty-seven years. The week after December Triple Witching is the best of all weeks after Triple Witching for DJIA and is the only one with a clearly bullish bias, advancing in twenty-nine of the last thirty-nine years. Small caps shine especially bright with a string of bullish days that runs from December 21 to 28.
Trading the day before and the day after Christmas is generally bullish across the board with the greatest gains coming from the day before (DJIA up nine of the last fourteen). On the last trading day of the year, NASDAQ has been down in fifteen of the last twenty-one years after having been up twenty-nine years in a row from 1971 to 1999. DJIA, S&P 500, and Russell 1000 have also been struggling recently and exhibit a bearish bias over the last twenty-one years. Russell 2000’s record very closely resembles NASDAQ, gains every year from 1979 to 1999 and only six advances since.
|
December 2021 Strategy Calendar
|
|
By:
Christopher Mistal
|
November 18, 2021
|
|
|
|
|
Seasonal Sector Trades: Copper Poised to Commence Seasonal Run Early
|
|
By:
Christopher Mistal & Jeffrey A. Hirsch
|
November 11, 2021
|
|
|
|
Next week is not only November’s monthly option expiration week, but it is also the last full week of trading before Thanksgiving. DJIA has a reasonably solid track record over the last 28 years, rising 19 times the week before Thanksgiving with a median gain of 0.41%. But the other major U.S. stock market benchmarks have not been as strong and there has been more weakness across the board recently. Since 2003 DJIA is up only 9 out of the last 18 years with a median loss of 0.09%.
S&P is up 16 of the last 28 years with a median gain of 0.24% and down 10 of the last 18, –0.16% median loss. NASDAQ is up 16 of the last 28 years with a median gain of 0.28% and down 9 of the last 18, +0.07% median gain. Russell 2000 is up 15 of the last 28 years with a median gain of 0.54% and down 10 of the last 18, –0.20% median loss. If weakness does manifest next week, it maybe a good set up for the Thanksgiving trade of buying into weakness the week before Thanksgiving and selling into strength around the holiday and typical November end-of-month strength.
Copper’s Bullish Seasonality
Copper has a tendency to make a major seasonal bottom in November/December and then a tendency to post major seasonal peaks in April or May. This pattern could be due to the buildup of inventories by miners and manufacturers as the construction season begins in late-winter to early-spring. Auto makers are also preparing for the new car model year that often begins in mid- to late-summer. Traders can look to go long a May futures contract on or about December 14 and hold until about February 24. In this trade’s 49-year history, it has worked 32 times for a success rate of 65.3%. After four straight years of declines from 2012 to 2015, this trade was successful three years in a row with increasing theoretical gains. In 2020 the trade was a bust as Covid-19 emerged in China and spread worldwide.
Cumulative profit, based upon trading a single futures contract excluding commissions and fees, is a respectable $90,375. Just over one-fifth of that profit came in 2007, as the cyclical boom in the commodity market magnified that year’s seasonal price move. However, this trade has produced other big gains per single contract, such as last year’s $16,350 gain, and even back in 2011, it registered another substantial $14,475 gain. These numbers show this trade can produce big wins and big losses if not properly managed. A basic trailing stop loss could have mitigated many of the historical losses.
![[Long Copper (May) Trade History Table]](/UploadedImage/AIN_1221_20211111_HG_History.jpg)
In the following chart, the front-month copper futures weekly price moves and seasonal pattern are plotted. Typical seasonal strength in copper is depicted by a blue arrow in the lower pane of the chart. Last year’s seasonal period is visible in the top pane of the chart accompanied by another blue arrow. Since copper’s May peak, it has been trading modestly lower in a sideways trend. This sideways trend is likely to be snapped by a breakout to the upside. Massive infrastructure spending is expected to be signed soon. The $1 trillion spending package is highly likely to be bullish for copper and its numerous uses.
![[Copper (HG) Bars and Seasonal Pattern Chart (Weekly Data November 2020 – November 11, 2021)]](/UploadedImage/AIN_1221_20211111_HG_Seasonal.jpg)
One option that provides exposure to the copper futures market without having to have a futures trading account, is United States Copper (CPER). This ETF tracks the daily performance of the SummerHaven Dynamic Copper Index Total Return less fund expenses. CPER’s daily volume can be on the light side, but it does appear to be sufficiently liquid with average daily volume approaching 300,000 shares. Stochastic, relative strength and MACD technical indicators applied to CPER are all beginning to improve. A position in CPER can be considered at current levels up to a buy limit of $27.20. If purchased an initial stop loss of $24.90 is suggested. This trade will be tracked in the Almanac Investor Sector Rotation ETF Portfolio. For tracking purposes, CPER will be added to the portfolio using its average daily price on November 12.
![[United States Copper (CPER) Daily Bar Chart]](/UploadedImage/AIN_1221_20211111_CPER.jpg)
Another way to gain exposure to copper and its seasonally strong period is through the companies that mine and produce copper. Global X Copper Miners ETF (COPX) holds shares of some of the largest copper miners and producers from across the globe. Its top five holdings as of November 10, 2021 are: Sumitomo Metal Mining, Lundin Mining, OZ Minerals, Freeport-McMoRan and Zijin Mining. COPX could be considered near current levels up to a buy limit of $37.70. If purchased, an initial stop loss of $33.85 is suggested. This trade will also be tracked in the Sector Rotation section of the ETF Portfolio. For tracking purposes, COPX will be added to the portfolio using its average daily price on November 12.
|
ETF Trades & Updates: Energy Early & Broad Gains Already
|
|
By:
Christopher Mistal
|
November 04, 2021
|
|
|
|
As the top month of the year for S&P 500 (since 1950), Russell 1000 and Russell 2000 (since 1979) and second best for DJIA (since 1950) and NASDAQ (since 1971), November has historically and frequently been a solid month for equity bulls. In the most recent 21-year period, average gains have even been improving for DJIA, S&P 500, Russell 1000 and Russell 2000. However, strength has not been evenly spread across the entire month.
As you can see in the following seasonal chart based upon daily performance over the last 21-years, November has typically opened well with nice gains spanning the first four trading days. Following this move higher the major indexes have tended to trade sideways and modestly lower until the last seven trading days at which point, they have historically sprung back to life and surged higher to close out the month. If you missed
our Seasonal MACD Buy signal in October and/or are looking for a dip to add to existing positions, November may provide that opportunity.
New November (actually December) Seasonality
There are no new sector seasonalities that begin in November, however oil companies typically come into favor in mid-December and remain so until late April or early May in the following year (yellow box in chart below). This trade has averaged 5.8%, 5.0%, and –0.4% over the last 15-, 10-, and 5-year periods. Sizable declines in 2017 and 2020 have depressed average performance and seasonal strength in crude oil has been ending sooner, typically in late April or early May instead of late June or July over the past ten years. This seasonality is not based upon the commodity itself (crude oil or natural gas); rather it is based upon NYSE ARCA Oil & Gas index (XOI). This price-weighted index is composed of major companies that explore and produce oil and gas.
![[NYSE Arca Oil Index (XOI) Weekly Bars and Seasonal Pattern since 11/9/1984]](/UploadedImage/AIN_1221_20211104_XOI_Seasonal.jpg)
Both crude oil and natural gas have risen sharply since the darkest days of the pandemic and its resulting global economic shutdown. Cuts that were made to production last year have not been unwound quick enough to keep up with surging demand during the reopening recovery. Additionally, the recovery appears to have created new demand as many commuters appear to prefer private transportation over public. Today’s announcement that OPEC and Russia intend to stick with their current plan of only modest increases in supply despite numerous calls for more also appears to be bullish for crude oil prices in coming months.
SPDR Energy (XLE) is the top pick to trade this seasonality. A new position in XLE could be considered near current levels up to a buy limit of $57.65. Employ a stop loss of $51.89. Take profits at the auto sell of $73.19. Exxon Mobil is the top holding in XLE at 22.36%. The remaining top five holdings of XLE are Chevron, Schlumberger, EOG Resources and Pioneer Natural Resources. For tracking purposes, XLE will be added to the portfolio using its average daily price on November 5.
Sector Rotation ETF Portfolio Update
Over the last week the market has continued to rally and all positions in the portfolio were in the black as of the close on November 3. Thus far the top performing position is SPDR Consumer Discretionary (XLY) up 13.2%. Earnings expectations for many traditional brick and mortar stores were apparently way too low as numerous beats in the most recent quarter helped to propel shares higher. Recent strength in Tesla (TSLA) and Amazon (AMZN), the second and first largest holdings of XLY, have also contributed significantly. iShares DJ US Tech (IYW) and iShares Semiconductor (SOXX) are also up double digits since being added to the portfolio.
With the exception of SPDR Gold (GLD), all other positions can still be considered on dips below their respective buy limits. There is ample time remaining of the Best Months and individual sector seasonalities for these positions to rise further. GLD is on Hold as its corresponding sector seasonality comes to an end in December. Semiconductor and Telecom strength has also traditionally ended in December, but more recently, strength has been lasting longer. Please see the next table for updated buy limits and stop losses.
Tactical Seasonal Switching Strategy Portfolio Update
Our overall outlook remains bullish for the Best Months. Thus far, this has been the correct view as the average gain in the Tactical Seasonal Switching portfolio is 6.7% since we issued our Seasonal Buy Signal. Invescos QQQ (QQQ) is the best performing position, up 9.0% as of November 3 close. The laggard so far is SPDR DJIA (DIA), up a still respectable 4.1%. iShares Russell 2000 (IWM) is also up an impressive 7.5%. It would not be surprising to see IWM take the top spot from QQQ as the strongest part of small-cap historical seasonal strength does not begin until around mid-December.
Based upon November’s typical seasonal pattern presented above, all positions in the portfolio can be considered on dips below their respective buy limits. As a reminder, these positions are intended to be held until we issue corresponding Seasonal MACD Sell Signals next year after April 1 for DJIA and S&P 500 and after June 1 for NASDAQ and Russell 2000. As a result, no stop loss is suggested on these positions.