If you missed the member’s only webinar on Wednesday, the slides and video recording are available
here (or copy and paste in a new browser window: https://www.stocktradersalmanac.com/LandingPages/webinar-archive.aspx).
In the webinar we reviewed key seasonal pattern charts that we have been tracking throughout the year, the Iran war stalemate, how Q3 weakness sets up the 4-year cycle “Sweet Spot,” how the midterm year seasonal pattern could be overtaking the Trump year pattern, key technical support levels to watch for DJIA, S&P 500, and NASDAQ, a quick rundown of select commodity technicals and seasonals, along with Fed hesitation blues.
Despite today’s rebound rally driven by Microsoft and semiconductors, market headwinds are increasing. August and September are the worst two months of the year for the stock market. The Iran war appears to be worsening as Iran and its proxies continue to expand the scope of their attacks in what appears to be an effort to drive energy prices higher yet.
Inflation also remains well above the Fed’s stated 2% target. Today’s personal consumption expenditures price index (PCE) was down 0.1% from the prior month but year-over-year was still up 3.7%. Although today’s PCE was the first monthly decline in years, it is not expected to continue since energy prices have risen over the last month.
Also concerning was today’s advance estimate for Q2 gross domestic product (GDP), which came in at just 1.5%. While this figure is subject to revision, it was below expectations and points to a slowdown in economic activity from Q1’s pace of 2.1%. Historically, the combination of slow growth and elevated inflation has not been favorable for the stock market.
The risk of a seasonal pullback or retreat in the August to October timeframe appears to be increasing. For now, sitting tight and waiting for a better entry point is likely still the best course of action. The key index levels highlighted in the
August Outlook and yesterday’s webinar remain in play.
New Trade Ideas Based Upon August Sector Seasonalities
Two new bullish sector trades begin in August, but we are going to take a measured approach and not rush. The new trade ideas are suggested on dips with buy limits that are below current prices. If the new positions do not dip below their respective buy limits, that is fine as we can consider them again when the “Worst Months” end.
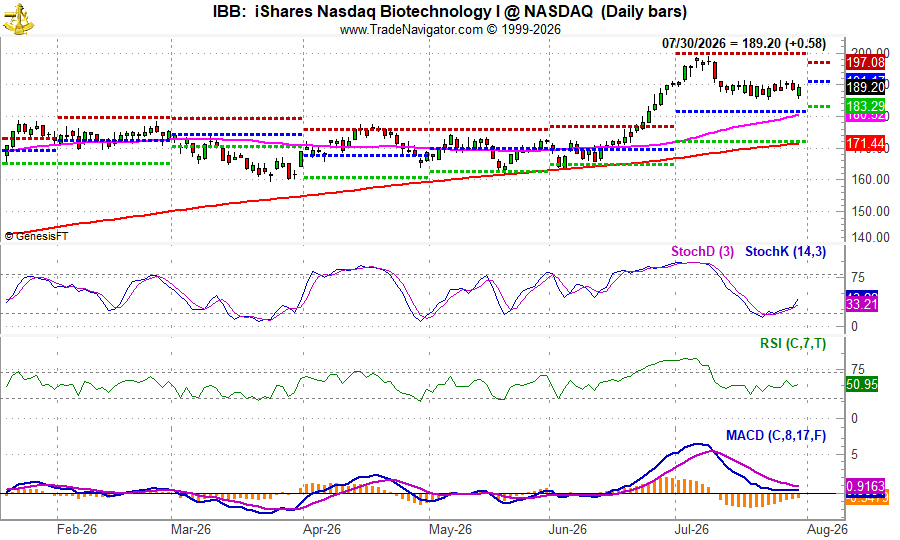
The biotechnology sector enters its historical favorable season in August. iShares Biotech (IBB) can be considered on dips below its buy limit of $182.45. A stop at $161.01 is suggested. The auto-sell price is $243.42 based upon historical average performance plus an additional 20%. An 11.18% average gain has occurred over the last 25 years while an average gain of 3.83% has occurred in the most recent 5 years (page 94 STA 2026) from the beginning of August through the beginning of March. Top five holdings are: Amgen, Vertex Pharmaceuticals, Gilead Sciences, Regeneron Pharmaceuticals, and argenx SE.
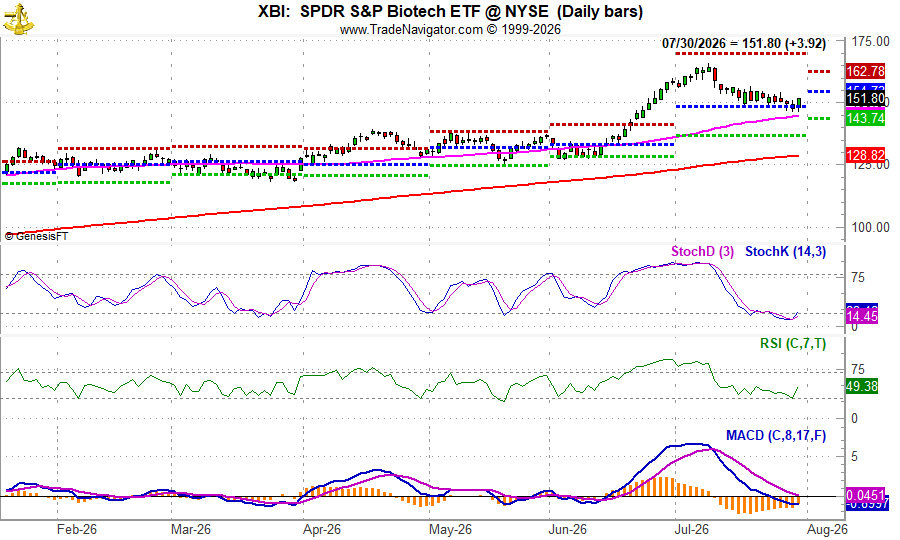
A second choice to consider for biotechnology seasonal strength is SPDR S&P Biotech (XBI). Unlike IBB, XBI tends to hold more speculative stocks with smaller market caps and its holdings are not as concentrated. XBI could be considered on dips below $142.25. If purchased, consider setting an initial stop loss at $125.54 and an auto-sell at $189.78. Top five holdings are: Apogee Therapeutics, Oruka Therapeutics, Dianthus Therapeutics, Kymera Therapeutics and Erasca.
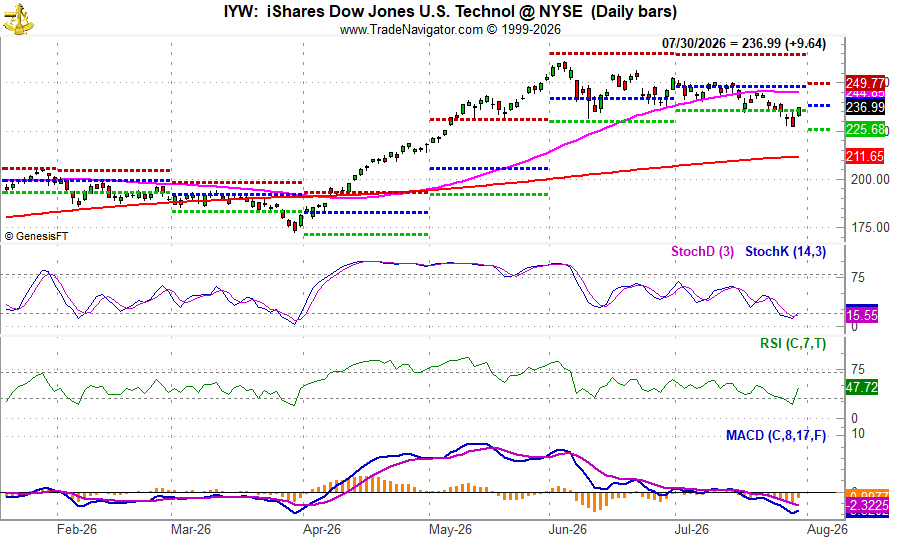
Over the last 25 years, Info-Tech has generated an average return of 9.67%, and for the last five years the average has been a solid 11.73% during its bullish season from mid-August to mid-January. Our top ETF within this sector is iShares US Technology (IYW). Set a buy limit at $208.50 and an initial stop loss of $184.00 if purchased. Should high-tech produce above average gains, profits can be taken at the auto-sell price of $274.39. IYW’s top five holdings are: Apple, Nvidia, Google (both share classes combined), Microsoft, and Broadcom. These five holdings represent a whopping 53.75% of IYW’s total holdings.
August’s final seasonality is a short trade in the Semiconductor sector. We are officially going to pass on this setup. Semiconductors have been trending lower since mid-June, but the day-to-day volatility makes shorting even more challenging. If you are comfortable with daily swings in excess of 5%, then perhaps shorting semiconductors is for you. If you are not, it is probably best to stay away until a new long trade opportunity clearly sets up, most likely sometime in or around October.
Sector Rotation ETF Portfolio Updates
Oil’s bearish seasonality comes to an end in August. We officially passed on trading this setup due to the ongoing Iran war. There is no corresponding position in the portfolio.
“Worst Months” defensive position in SPDR Consumer Staples (XLP), SPDR Healthcare (XLV), iShares Biotechnology (IBB), and SPDR Biotechnology (XBI) are on Hold. As of the close on July 29, all four positions were up on average 11.0%. Even after giving back some of their gains today, they are still outperforming the 3.2% gain by S&P 500 (as of July 30 close) since April 30.
SPDR Utilities (XLU) is on Hold. Excluding dividends and any trading fees XLU was down 3.9% yesterday. XLU has been held back by higher Treasury bond yields and cooling of the AI trade. Lower interest rates and a renewed interest in AI stocks could provide the utilities sector with the boost it needs. Longer-term, data center energy demand is likely to continue to grow.
Foreign ETFs, IDV, EFAV, and EFV are on Hold. Collectively, their average performance is a respectable 21.5% excluding dividends and any trading fees. Despite providing foreign market exposure, we suspect these ETFs could also present a better opportunity for additional purchases later this year, most likely in the September to October timeframe.
Trades in gold and silver related ETFs, GLD, SLV, GDX, and GDXJ have all been added to the portfolio. We were a little early to add them as the sector continued to soften through the first half of July. However, they have been showing some signs of strength and did jump today. GLD, SLV, GDX, and GDXJ can all still be considered at current levels or on dips below their respective buy limits.
Tactical Seasonal Switching Strategy Portfolio Update
In accordance with the July 17,
NASDAQ Seasonal MACD sell email Issue, QQQ and IWM have been closed out of the portfolio for gains of 15.5% and 19.8% respectively. As of today’s close, QQQ and IWM are still lower than when they were closed out.
Defensive positions in bond ETFs, TLT, AGG, BND, SHV and SGOV, are still flat to modestly negative excluding dividends and trading fees. TLT, AGG and BND are on Hold. The performance of TLT, AGG and BND will likely depend greatly upon the Fed and how it handles inflation. Our preferred bond ETFs are SHV and SGOV as both exhibit relatively stable pricing and have yields exceeding 3.5%.
Disclosure note: Officers of Hirsch Holdings Inc hold positions in EFAV, EFV, GLD, IBB, IDV, XBI, XLP, XLU and XLV in personal accounts.