|
Market-at-a-Glance - 2/27/2020
|
|
By:
Christopher Mistal
|
February 27, 2020
|
|
|
|
2/27/2020: Dow 25766.64 | S&P 2978.76 | NASDAQ 8566.48 | Russell 2K 1497.87 | NYSE 12547.25 | Value Line Arith 5861.28
Fundamental: Uncertain. The market appears to be driven purely by headlines now and uncertainty is growing. How big will the economic impact of the coronavirus be? Only time will tell. History suggests a short-term impact. Growth is likely to slow as supply chains and daily life are interrupted, but once the virus is contained and/or a viable vaccine is available economies are likely to return to normal. At which time any pent-up demand could result in a surge in growth.
Technical: Correction. As of today S&P 500 has experienced 26 corrections (decline greater than 10%, but less than 20%) since 1948. The current correction was confirmed today and is the quickest to reach the threshold. DJIA, S&P 500 and NASDAQ have all plunged below their respective 50- and 200-day moving averages and are still in search of support. Fear appears to be the biggest driving force now as the decline has certainly removed many of the excesses that recently existed.
Monetary: 1.50-1.75%. The Fed did not meet in February and their next meeting is in mid-March. Safe-haven demand has caused bonds to surge and yields to plunge. The declines in yields and uncertainty overhanging global growth outlooks due to spreading coronavirus could push the Fed to cut rates. However, the impact of even lower rates could be muted as the key issue is not exactly a financial condition, it is a medical concern.
Seasonal: Bullish. Normally a decent performing market month, March is above average in election years with advances 64.7% of the time with a 1.0% average DJIA gain since 1952. S&P 500 has also advanced 64.7% of the time since 1952, but gains have been slightly better at 1.2%, on average. NASDAQ has not fared well in March in election years since 1972 mainly due to a steep decline in 1980.
Psychological: Neutral. According to
Investor’s Intelligence Advisors Sentiment survey Bullish advisors are at 49.1%. Correction advisors are at 31.7% and Bearish advisors are 19.2%. However, this survey was taken right before the bulk of the current retreat transpired. Bullish sentiment has most likely had a further and more sizeable retreat since then. Historically, high levels of bearish and correction advisors are observed at new broad buying windows.
|
March Outlook: Coronavirus Fears Grip Wall Street
|
|
By:
Jeffrey A. Hirsch & Christopher Mistal
|
February 27, 2020
|
|
|
|
The Dow Jones Industrial Average suffered its worst one-day point loss today. The market was down all day, but fluctuated dramatically with the headlines. Today’s widespread selling pushed the market into official correction territory with the Dow down 12.8% from its February 12 all-time high. S&P 500 and NASDAQ are down 12.0% and 12.7% from their respective February 19 all-time highs.
At 8 calendars days long (6 trading days), this is the fastest 10% correction for the S&P 500 on record. Of the 36 previous corrections since 1950, 11 have turned into bears of -20% or more with an average loss of 34.4%. The 25 other corrections averaged a loss of 14.3% and lasted 133 calendar days on average. It was 422 calendar days from the end of the last correction on December 24, 2018 to the recent S&P high on February 19. We covered the
history of corrections on the blog back on January 6.
Fears of coronavirus spreading rapidly and causing some sort of lasting global supply chain disruption and economic downturn have come at a time of elevated market valuations, seasonal February weakness and the heating up of a contentious presidential election battle.
No matter how you slice it this is disconcerting for the market. But let’s look at the facts we have. This decline has brought elevated valuations and euphoric sentiment down from the recent lofty levels and election cycle patterns remain encouraging. Heightened fear of the virus spreading rapidly here in the U.S. and elsewhere has folks reacting to the headlines without reading further.
For example in this story from the Bay Area CBS affiliate “
California Monitoring 8,400 For Coronavirus; Shortage Of Testing Kits Addressed,” if you scroll down a bit and read the details of the story it says, “
The California Department of Public Health maintains the risk to the general population in California is low for the coronavirus, and that more than 80% of people infected with the virus have mild or no symptoms.”
Fear is clearly spreading faster than the virus. Official coronavirus numbers from best sources we can find show a situation that continues to improve on a global level. Using the data from the excellent interactive web-based dashboard that tracks the Global Cases of Coronavirus COVID-19 created by the
Center for Systems Science and Engineering (CSSE) at Johns Hopkins University we have created the table and graphs below.
The rate of new cases per day has decreased from the mid-February spike to 1.5% and the death rate has stabilized over the past few days with the vast majority on Mainland China. Optimistically, the recovery rate continues to rise and is now at 40.3%. Of the 82,594 global cases at this writing, 2,810 have died, 33,253 have recovered and 46,531 remain infected.
So, while there is still plenty to be concern about for all of us individually and for health and government officials the numbers we have are improving. On January 29 we detailed the
history of how contagions and outbreaks have impacted the market on the blog. Since the coronavirus was confirmed and made public on January 10, 2020 the S&P 500 is down 8.8% at today’s close.
Down January & December Closing Low
Coronavirus has also impacted a couple of our key indicators: the January Barometer (page 22 Stock Trader’s Almanac 2020) and the December Closing Low Indicator (page 34 Stock Trader’s Almanac 2020). January 31’s market decline turned the January Barometer negative as the S&P 500 finished January down 0.2%. This diminished our near-term outlook for the market as every down January since 1950 was followed by a new or continuing bear market, a 10% correction or a flat year.
Heightened coronavirus uncertainties this week knocked the Dow below its December closing low. Years the Dow has closed below its previous December closing low in Q1 the Dow has fallen 10.5% further on average. But in the last 22 occurrences since 1980, 15 of those years have seen gains for the rest of the year averaging 9.7%. Only two years had big hits 2002 (-14.1, Iraq War) and 2008 (-32.7, Financial Crisis).
The table below show the years when both the January Barometer as measured by the S&P 500 were down and the Dow closed below its previous December closing low in the first quarter. We have also created a composite seasonal pattern chart of these 22 years showing how the Dow, S&P 500 and NASDAQ Composite behaved on average in such years.
As you can see from this table and graph most of the negatives of a Down January and a Dow December closing low breach appear to have been satisfied. No one knows what will happen with this virus, but history and the data suggest we have seen the bulk of the worst of the virus and the market decline.
The “Best Six Months” have a 70-year track record and have worked over many timeframes and through crises, exogenous events and all types of markets. Our other seasonal and cyclical trading and investing strategies have also stood the test of time. So stick to the system, heed stop losses and remain rational.
Pulse of the Market
Rebounding from the first down January since 2016, DJIA got off to a strong start early in February before succumbing to rapidly spreading fears and worries over the coronavirus and its impact. The rate of the market’s decline appears to have outpaced the spread of the virus with DJIA diving below its 50- and 200-day moving averages (1) in just two trading sessions. This complete reversal of momentum has been confirmed by both the faster and slower moving MACD indicators (2). Both MACD indicators are currently negative and trending lower.
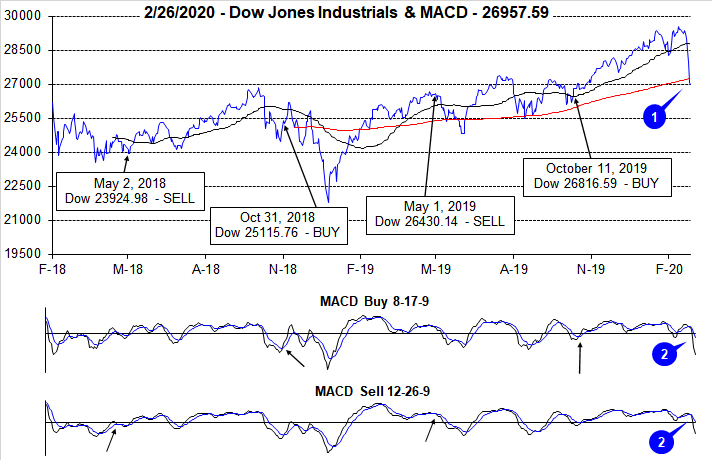
Earlier this week DJIA recorded its third Down Friday/Down Monday (DF/DM) of the year (3) after logging its second in the previous week. Back-to-back DF/DM occurrences have often been significant inflection points for the market, but with a post-occurrence track record that is similar to a single DF/DM. If a quick recovery from the DF/DM transpires, then the tendency is for the market not to suffer a prolonged, damaging retreat. Thus far, there has not even been an attempt at a bounce and/or recovery. Based upon Friday’s track record so far this year (down 7 of the last 8), it may be March before an up day materializes.
This week’s data does not appear in the table but there is little doubt it will look quite bad. Prior to this week’s market rout, NASDAQ had enjoyed sixteen weekly gains in 21 weeks (5). S&P 500 had fifteen advances in 20 weeks (4). DJIA was not as successful, up thirteen of 20 weeks. The relative tranquility the market had enjoyed since last August has come to an end. Volatility is likely to remain elevated as long as the coronavirus continues to spread, and governments continue to appear to struggle with its spread.
Market breadth measured by NYSE Weekly Advancers and NYSE Weekly Decliners (6) provided no indication that the market was on the verge of sinking into a correction right up until last week as readings remained consistent with the trend at that time. Positive weeks had NYSE Weekly Advancers exceeding Weekly Decliners while negative weeks had Weekly Decliners taking the majority.
Weekly New Highs did rebound with the market in the first half of February (7) and reached a peak of 669 two weeks ago when major indexes were trading at or near all-time highs. This was the largest number of New Highs since December 9, 2016. There likely won’t be many New Highs this week while New Lows are likely to swell.
The 30-year Treasury bond yield fell below 2% for the first time since the end of August 2019 last week (8). Safe haven demand, of which the 30-year Treasury is, has continued to rally this week. When the rush to safe haven assets slows, it could be an early indication that the selloff may be nearing its end.
Click for larger graphic…
|
March Almanac & Vital Stats: Election Year Overshadowed By 1980
|
|
By:
Jeffrey A. Hirsch & Christopher Mistal
|
February 20, 2020
|
|
|
|
Boisterous March markets tend to drive prices up early in the month and batter stocks at month end. Julius Caesar failed to heed the famous warning to “beware the Ides of March” but investors have been served well when they have. Stock prices have a propensity to decline, sometimes rather precipitously, during the latter days of the month. In March 2001, DJIA plunged 1469 points (-11.8%) from March 9 to the 22.
March packs a rather busy docket. It is the end of the first quarter, which brings with it Triple Witching and an abundance of portfolio maneuvers from The Street. March Triple-Witching Weeks have been quite bullish in recent years. But the week after is the exact opposite, DJIA down 22 of the last 32 years—and frequently down sharply for an average drop of 0.72%. In 2018, DJIA lost 1413 points (–5.67%) Notable gains during the week after for DJIA of 4.88% in 2000, 3.06% in 2007, 6.84% in 2009, and 3.05% in 2011 are the rare exceptions to this historically poor performing timeframe.
Normally a decent performing market month, March is above average in election years with advances 64.7% of the time with a 1.0% average DJIA gain since 1952. S&P 500 has also advanced 64.7% of the time since 1952, but gains have been slightly better at 1.2%, on average. NASDAQ has not fared well in March in election years since 1972. Due to a 17.1% loss in 1980, March is NASDAQ’s second worst month of the election year. Similarly, March 1980’s steep losses adversely affect Russell 1000 and Russell 2000 indices.
Saint Patrick’s Day is March’s sole recurring cultural event. Gains the day before Saint Patrick’s Day have been greater than the day itself and the day after. Perhaps it’s the anticipation of the patron saint’s holiday that boosts the market and the distraction from the parade down Fifth Avenue that causes equity markets to languish. Or maybe it’s the fact that Saint Pat’s usually falls in historically bullish Triple-Witching Week.
Whatever the case, since 1950, the S&P 500 posts an average gain of 0.19% on Saint Patrick’s Day (or the next trading day when it falls on a weekend), a gain of 0.13% the day after and the day before averages a 0.24% advance. S&P 500 median values are 0.18% on the day before, 0.22% on Saint Patrick’s Day and 0.05% on the day after. In the tens years when St. Patrick’s Day falls on a Tuesday, like this year, since 1950, the day before (Monday) produced an average gain of 0.07%, while Tuesday advanced an average 0.66% and Wednesday averaged 0.38%.
| March (1950-2019) |
| |
DJI |
SP500 |
NASDAQ |
Russell
1K |
Russell 2K |
| Rank |
|
5 |
|
4 |
|
6 |
|
5 |
|
5 |
| #
Up |
|
45 |
|
45 |
|
31 |
|
27 |
|
29 |
| #
Down |
|
25 |
|
25 |
|
18 |
|
14 |
|
12 |
| Average
% |
|
1.0 |
|
1.2 |
|
0.9 |
|
1.1 |
|
1.3 |
| 4-Year Presidential Election Cycle Performance
by % |
| Post-Election |
|
0.3 |
|
0.6 |
|
-0.2 |
|
0.7 |
|
1.1 |
| Mid-Term |
|
1.0 |
|
1.1 |
|
1.3 |
|
1.6 |
|
2.7 |
| Pre-Election |
|
1.8 |
|
1.9 |
|
3.1 |
|
2.0 |
|
2.6 |
| Election |
|
1.0 |
|
1.2 |
|
-0.9 |
|
0.1 |
|
-1.1 |
| Best & Worst March by % |
| Best |
2000 |
7.8 |
2000 |
9.7 |
2009 |
10.9 |
2000 |
8.9 |
1979 |
9.7 |
| Worst |
1980 |
-9.0 |
1980 |
-10.2 |
1980 |
-17.1 |
1980 |
-11.5 |
1980 |
-18.5 |
| March Weeks by % |
| Best |
3/13/09 |
9.0 |
3/13/09 |
10.7 |
3/13/09 |
10.6 |
3/13/09 |
10.7 |
3/13/09 |
12.0 |
| Worst |
3/16/01 |
-7.7 |
3/6/09 |
-7.0 |
3/16/01 |
-7.9 |
3/6/09 |
-7.1 |
3/6/09 |
-9.8 |
| March Days by % |
| Best |
3/23/09 |
6.8 |
3/23/09 |
7.1 |
3/10/09 |
7.1 |
3/23/09 |
7.0 |
3/23/09 |
8.4 |
| Worst |
3/2/09 |
-4.2 |
3/2/09 |
-4.7 |
3/12/01 |
-6.3 |
3/2/09 |
-4.8 |
3/27/80 |
-6.6 |
| First Trading Day of Expiration Week: 1990-2019 |
| #Up-#Down |
|
21-9 |
|
21-9 |
|
17-13 |
|
19-11 |
|
18-12 |
| Streak |
|
U1 |
|
U1 |
|
U7 |
|
U1 |
|
U3 |
| Avg
% |
|
0.22 |
|
0.14 |
|
-0.11 |
|
0.10 |
|
-0.14 |
| Options Expiration Day: 1990-2019 |
| #Up-#Down |
|
16-14 |
|
19-11 |
|
14-16 |
|
17-13 |
|
13-16 |
| Streak |
|
U2 |
|
U2 |
|
U5 |
|
U2 |
|
U5 |
| Avg
% |
|
0.20 |
|
0.11 |
|
-0.07 |
|
0.08 |
|
-0.04 |
| Options Expiration Week: 1990-2019 |
| #Up-#Down |
|
22-8 |
|
22-8 |
|
19-11 |
|
21-9 |
|
17-13 |
| Streak |
|
U1 |
|
U1 |
|
U1 |
|
U1 |
|
U1 |
| Avg
% |
|
0.99 |
|
0.89 |
|
0.14 |
|
0.82 |
|
0.34 |
| Week After Options Expiration: 1990-2019 |
| #Up-#Down |
|
10-20 |
|
7-23 |
|
13-17 |
|
7-23 |
|
13-17 |
| Streak |
|
D5 |
|
D8 |
|
D7 |
|
D8 |
|
D8 |
| Avg
% |
|
-0.53 |
|
-0.40 |
|
-0.11 |
|
-0.38 |
|
-0.24 |
| March 2020 Bullish Days: Data 1999-2019 |
| |
2,
12, 26, 18, 30 |
2,
4, 12, 16, 18 |
2,
4, 12, 17-20 |
2,
4, 12, 18 |
2, 12, 17, 18, 23 |
| |
|
|
25,
30 |
|
25, 31 |
| March 2020 Bearish Days: Data 1999-2019 |
| |
3,
24, 26 |
3,
13, 23, 26 |
3,
6, 13, 26 |
3,
13, 23, 26 |
13, 26 |
| |
|
|
|
|
|
|
March 2020 Strategy Calendar
|
|
By:
Christopher Mistal
|
February 20, 2020
|
|
|
|
|
Stock Portfolio Update: Large Caps Soar While Small Caps Fizzle
|
|
By:
Christopher Mistal
|
February 13, 2020
|
|
|
|
After closing at fresh all-time closing highs yesterday, the coronavirus (COVID-19) returned today to push major indexes modestly lower. A sizable revision higher to the number infected and a warning from a top CDC official was the news that unsettling traders and investor in the early hours of today’s trading. However when looking at DJIA, S&P 500 and NASDAQ’s year-to-date performance through today’s close, COVID-19 does not appear to be having much of an impact.
As of today’s close, DJIA is up 3.1%, S&P 500 +4.43% and NASDAQ is up a whopping 8.2%. All three indexes are well above their respective historical averages for this time of an election year. NASDAQ has in fact already exceeded its average full election year performance going back to 1971. Bullish sentiment and momentum appear to be firmly in place and historical election year patterns suggest strength could easily continue for DJIA and S&P 500 into May. NASDAQ’s surge higher could be vulnerable to a retreat sooner, in March.
Stock Portfolio Update
In the time since last update through yesterday’s close the Almanac Investor Stock Portfolio climbed 0.2% higher compared to a 4.6% advance by S&P 500 and a 1.3% gain from the Russell 2000. Small-Caps fizzling, and the portfolio’s sizable cash position limited overall portfolio performance. Solid gains made by Large-Caps were able to offset losses in the Small- and Mid-Cap portfolios. The January Effect, as we refer to the historical tendency of small-cap stocks to outperform large-caps stocks from around mid-December to March has been a no-show this year.
Our Free Lunch Basket of stocks was something of a dud this time around. No January Effect and the limited number of new 52-weeks lows available to select from are high on the list of possible reasons for the basket’s poor showing. Of the 13 original positions selected in December, Groupon (GRPN) was the last to be stopped out. GRPN was the largest stock selected based upon market cap and it also had the best performance, up 27.3%. Theratechnologies (THTX), Energous Corp (WATT) and Zosano Pharma (ZSAN) were all closed out in early January for modest single-digit gains. Capital Senior Living (CSU) and Jianpu Technology (JT) were stopped out around mid-January, but for modest losses. Free Lunch has officially come to an end.
Energy stocks also had a challenging time so far this year. Modest global growth and ample supply has kept energy prices largely in check, but the added fears over the potential impacts of the COVID-19 has done even more damage. A relatively mild winter has also been weighting on the sector. Four energy-related positions were stopped out. Callon Petroleum (CPE), Northern Oil & Gas (NOG), Matador Resources (MTDR) and Murphy Oil (MUR). Energy could find a seasonal bottom this month or in early March, but the bottom could also be delayed even further by COVID-19.
Large-cap dominance is clearly visible in the broad market and in our portfolio. Only one position, Encana Corp (now Ovintiv) was stopped out over the past six weeks and it is also from the energy sector. The position was stopped out in the final days before it completed a one-for-five reverse split as part of its restructuring and move from Canada to the U.S. on January 21. The majority of the remaining large-cap positions have enjoyed gains so far this year. Brown and Brown (BRO) is one notable standout that is up 18.6% year-to-date as of yesterday’s close. Lennar Corp (LEN) is also having a good year so far, up 26.1%.
All positions in the portfolio are currently on Hold. Please see table below for current advice, suggested stop losses and where applicable buy limits.
|
ETF Trades & Updates: Market Surges Back from Coronavirus
|
|
By:
Christopher Mistal
|
February 06, 2020
|
|
|
|
China is cutting tariffs; the impeachment process has come to an end and the market is at new all-time highs. The coronavirus is still a concern, but apparently not as much as it was less than one week ago. Progress has been made. Official emergency declarations have mobilized a stronger response. China has quickly built additional hospitals and work is underway on a treatment. Gilead (GILD) appears to be the first to offer a potential cure although its drug remdesivir has not been approved to cure any disease yet. These recent developments along with solid earnings, have been the fuel to reverse the market’s late January retreat in just a few trading sessions this month.
![[DJIA Daily Bar Chart]](/UploadedImage/AIN_0320_20200206_DJIA.jpg)
![[S&P 500 Daily Bar Chart]](/UploadedImage/AIN_0320_20200206_SP500.jpg)
![[NASDAQ Daily Bar Chart]](/UploadedImage/AIN_0320_20200206_NAS.jpg)
In the above charts, the market’s strength since October can be seen along with second half of January weakness. DJIA, S&P 500 and NASDAQ have remained comfortably above their respective 200-day moving averages since October. In January only DJIA actually (and briefly) closed below its even higher 50-day moving average. The market’s rebound surge in February has also reversed negative readings from Stochastic, relative strength and MACD indicators.
Momentum clearly favors the bulls and January’s negative finish remains unconfirmed as of today. As long as economic data and corporate earnings remain positive then the market is likely to continue the trend that has been in place since last October, higher. There are likely to be some dips along the way with the next possible soft patch arriving when earnings season nears its end later this month and/or in the first half of March.
Sector Rotation ETF Portfolio Update
January may have closed on a sour note, but February has gotten off to a strong, above average start. Strength has been relatively broad-based with technology leading overall. As of yesterday’s close, four technology-related positions, iShares NASDAQ Biotech (IBB), iShares DJ US Tech (IYW), iShares PHLX Semiconductor (SOXX) and SPDR Technology (XLK) are all up more than 20% since being added to the portfolio in October. As a result of this strong showing by tech, the average portfolio open position gain is now 13.0%
With growth capturing the majority of attention other areas have been lagging. Vanguard REIT (VNQ) has been essentially left for dead, up just 2.4%. Another lagging position, iShares DJ US Telecom (IYZ), was stopped out January 31 for a modest gain of 2.3%.
Recent energy and copper related trades did not fare well in January as the coronavirus initially began to spread rapidly triggering quarantines, evacuations and emergency declarations. The potential unknown impacts of the virus on global economic growth hit copper and energy first. SPDR Energy (XLE), United States Copper (CPER), Global X Copper Miners (COPX), First Trust Natural Gas (FCG) and United States Natural Gas (UNG) were all stopped out.
The selloff in copper and energy appears to be overdone especially when the broader markets performance is taken into consideration. XLE, CPER, COPX, FCG and UNG can all be considered at current levels up to their respective buy limits. New buy limits and stop losses for these new trades appear in the Sector Rotation Portfolio table below.
With the exception of today’s trade ideas, all other positions in the portfolio are currently on Hold. Due to recent gains, numerous stop losses have been updated. Please see table below for updated stop losses.
Tactical Seasonal Switching Strategy Portfolio Update
Even though January was down, we remain bullish for the balance of the Best Six/Eight Months as other patterns and indicators have thus far failed to provide backup for the negative reading. The market has quickly reversed direction and is once again trading at new all-time highs.
As of yesterday’s close, the Tactical Seasonal Switching Strategy portfolio has an average gain of 13.2% since our Seasonal Buy Signal in October. Invescos QQQ (QQQ) has led the way higher and was up 19.4% as of yesterday’s close. SPDR DJIA (DIA) is still the laggard. All positions in the portfolio are on Hold.
Please note, positions in the Tactical Switching Strategy portfolio are intended to be held until we issue corresponding Seasonal MACD Sell Signals sometime on or after April 1. As a result, no stop loss is currently suggested on these positions.