|
Market at a Glance - 7/29/2021
|
|
By:
Christopher Mistal
|
July 29, 2021
|
|
|
|
7/29/2021: Dow 35084.53 | S&P 4419.15 | NASDAQ 14778.26 | Russell 2K 2240.03 | NYSE 16697.14 | Value Line Arith 9630.66
Fundamental: Softening. U.S. Q2 GDP came in below expectations today at 6.5%. Weekly initial jobless claims appear to be plateauing right around 400,000 possibly ending the trend of falling claims. Corporate earnings in Q2 have been solid, but Q3 year-over-year comparisons are likely to be more challenging. The Delta variant of the coronavirus that causes Covid-19 is rapidly spreading causing yet another wave of cases while domestic daily vaccination numbers are falling. The increase in cases is triggering new mask mandates and causing some employers to delay the return to the office.
Technical: Breakout stalling? DJIA, S&P 500 and NASDAQ have all broken out to new all-time highs. However, the momentum that pushed them higher appears to be fading. Weekly and cumulative advance/decline metrics are tepid suggesting the move to marginally higher new highs is being done with limited participation. Historically as participation fizzled so has the rally.
Monetary: 0 – 0.25%. Although the Fed met earlier this week, nothing new was said in their official statement. There was no change in existing policy while they reiterated that they are willing to tolerate above target inflation in the expectation of achieving that target over the longer-term. Current inflation metrics are still viewed as transitory. The bond market appears to agree and so do we.
Seasonal: Bearish. August is the worst DJIA and S&P 500 month during 1988-2020 and second worst for NASDAQ. In post-election years since 1950, August is still ranked no higher than #11 while average performance slips deeper into negative territory. The Summer Volume Doldrums historically span all of August as traders and investors escape the office and head out on vacations.
Psychological: Bulls in retreat. According to
Investor’s Intelligence Advisors Sentiment survey Bullish advisors have slipped to 52.6%. Correction advisors have increased to 30.9% while Bearish advisors have crept up to 16.5%. The recent pullback in bullish sentiment combined with a modest uptick in correction/bearish is encouraging, overall sentiment is still at an elevated level. Current levels appear to support a market that is likely to continue to meander higher with the occasional dip along the way.
|
August Outlook: Rally Primed To Pause in Worst Months
|
|
By:
Jeffrey A. Hirsch & Christopher Mistal
|
July 29, 2021
|
|
|
|
Our outlook for the full year remains clearly bullish, more in line with the best cast scenario of our
Annual Forecast made last December. S&P 500 is already up 17.7% so far this year at 4419.15. Our updated outlook is for S&P 500 to finish the year in the 4500-4600 range or even higher, but we do anticipate the rally to pause over the next 2-3 months during the worst two months of the year.
For the past 33 years from 1988-2020 August and September are the worst two months of the year for DJIA, S&P 500 and NASDAQ. August is the worst for DJIA and S&P 500 and September is worst for NASDAQ. August is up only 18 of the past 33 years for DJIA and S&P 500 with average losses of -0.8% and -0.6% respectively. NASDAQ is a bit better in August up 19 of 33 years with an average gain of +0.2%.
September actually has more losses for the Dow (up only 16 of 33, average -0.5%) and S&P (up 17 of 33, average -0.3%). NASDAQ has been up 20 of 33 Septembers with an average loss of -0.1%. The average losses are not huge but the trend of volatility is consistent with a plethora of sizable drops, most notably in August 2015, 2013, 2011, 2010, 2001, 1998, 1997, 1992 and 1990 and in September 2020, 2015, 2011, 2008, 2002, 2001, 2000 and 1990.
Bullish forces continue to persist. The Fed remains easy and accommodative. More fiscal stimulus is likely from Washington as Congress nears finalizing the deals on infrastructure and spending. Economic readings remain robust, but Q2 GDP was below expectations. Q2 earnings season has been rather stellar, but Q3 comps will not be as easy. This Covid-19 Delta variant is a concern and poses a threat to the bull and the economic expansion. Political wrangling here in The States and geopolitical machinations around world could also knock the market off course momentarily.
Despite the persistence and resilience of this bull rally market internals and technicals are showing some signs of fatigue. Advancing issues have barely outpaced decliners in recent weeks. New highs have been shrinking while new lows remain high. Technical indicators are still struggling to break through resistance with Relative Strength, Stochastics and MACD breaking down again.
In addition to the exogenous threats from Covid, U.S. politics, geopolitics, internals and technicals, the timing of a pause coincides with the weak seasonal patterns mentioned above during the worst months of the year August and September (not to mention Octoberphobia) as well as the 4-Year Presidential Election Cycle.
As you can see in the chart here of the Modern 4-Year Presidential Election Cycle indicated by the black arrow we are due for a pause over the next couple of months before the rally resumes in the September/October timeframe. This illustration of the average 4-year cycle uses the S&P 500 back to 1949, which is the first full cycle post-WWII vs. other comparisons that use the Dow back 125 years to 1896.
This more recent dataset is a better representation of the modern cycle where post-election years have been better and election years weaker – impacted by the undecided election in 2000 and the financial crisis of 2008. Midterm years are still lackluster with propensity for the significant bottoms and pre-election years are still the tops.
This creates the sweet spot of the 4-year cycle from Q4 in the midterm year through Q2 in the pre-election year. From the midterm low to the pre-election year high DJIA averages a 45% gain since 1950 and NASDAQ averages a 70% gain since 1974.
The recent gains are impressive and hard to resist, but history tells us that it is prudent to be cautious at this time of year. We believe it is the best course of action to sit tight, be patient and use the time to reposition your portfolio for the August/September summer doldrums and prepare to pounce on our next Best 6/8 Months Buy Signal for the yearend rally.
Perhaps it’s anecdotal, but the continuing market rally and the new highs since last month caused us to recalibrate the vertical axis scale on our DJIA & MACD chart below. It may be mere coincidence, but every time we’ve had to raise the top end of the scale it has been just prior to a rally pause and pullback.
Pulse of the Market
For the first time in its history, DJIA (1) closed above 35,000 last Friday, July 23. Other than being a nice, round number there does not appear to be any other major significance from this level. It is interesting to note that DJIA was less than 1% from eclipsing this level in early May and it took over two months to finally break through it. From 35,000, DJIA is now less than 11% away from our Super Boom forecast from May 2010 of DJIA 38,820 by 2025. DJIA’s jump above 35,000 was also sufficient to turn both its faster and slower moving MACD indicators positive (2) after a brief extent of being negative that commenced just after mid-July.
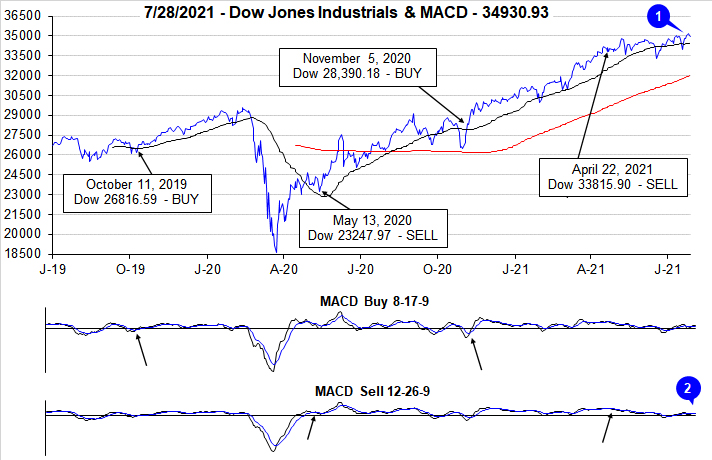
That mid-July weakness also triggered the second Down Friday/Down Monday (DF/DM) of 2021 (3). Historically,
DF/DM occurrences have been observed around or near market inflection points, but most frequently have foreshadowed market weakness. Research has shown that when DJIA has recovered quickly from the DF/DM losses, further near-term weakness has usually been avoided. Thus far, the most recent occurrence appears to fall into this category as DJIA has quickly rebounded.
Another wave of rising Covid-19 cases appears to have triggered renewed interest in mega-cap tech stocks. After declining for four straight weeks in late-April and early May, NASDAQ (5) has advanced in eight of the last ten weeks. Tech-heavy S&P 500 (4) has also benefited climbing in seven of the last nine weeks. Solid Q2 earnings reports have also supported the major indexes.
In spite of general market strength over the last five weeks, market breadth measured by NYSE Weekly Advancers and NYSE Weekly Decliners (6) has been rather tepid over the past four weeks. Last week’s numbers are a disappointment considering the magnitude of the weekly gains logged by S&P 500 and NASDAQ with Weekly Advancers only narrowly exceeding Weekly Decliners. If this week’s numbers improve that would be encouraging. Absent a meaningful improvement this week there could be new weakness in August and/or possibly beyond.
The trend of Weekly New Highs (7) is also worrisome as they continue to shrink even as the major indexes trade at new all-time highs. Last week’s number of Weekly Highs was well below their peak reached in mid-March at 951. A reversal in this trend of dwindling New Highs would suggest the market is poised to make a more sizable move higher. New Weekly Lows are also remaining stubbornly elevated which also hints at continued sideways trading with a minor bias to the upside.
Even with inflation metrics coming in at multi-year highs, the spread between the 90-day Treasury rate and the 30-year Treasury rate continues to narrow (8). A flattening yield curve is generally not good for banks but falling longer-term rates do typically provide a boost to corporations and consumers. Corporations can continue to finance stock buybacks and dividend increases while consumers could see lower rates for mortgages and other major purchases (if the banks are willing to lend).
Click for larger graphic…
|
August Almanac & Vital Stats: Challenging Month in Post-Election Years
|
|
By:
Jeffrey A. Hirsch & Christopher Mistal
|
July 22, 2021
|
|
|
|
Money flows from harvesting made August a great stock market month in the first half of the Twentieth Century. It was the best month from 1901 to 1951. In 1900, 37.5% of the population was farming. Now that less than 2% farm, August is amongst the worst months of the year. It is the worst DJIA, S&P 500, Russell 1000 and Russell 2000 month over the last 33 years, 1988-2020 with average declines ranging from 0.4% by Russell 2000 to 0.8% by DJIA. For NASDAQ August ranks second worst over the same period with an average gain of 0.2%.
Contributing to this poor performance since 1987; the second shortest bear market in history (45 days) caused by turmoil in Russia, the Asian currency crisis and the Long-Term Capital Management hedge fund debacle ending August 31, 1998 with the DJIA shedding 6.4% that day. DJIA dropped a record 1344.22 points for the month, off 15.1%—which is the second worst monthly percentage DJIA loss since 1950. Saddam Hussein triggered a 10.0% slide in August 1990. The best DJIA gains occurred in 1982 (11.5%) and 1984 (9.8%) as bear markets ended. Sizeable losses in 2010, 2011, 2013 and 2015 of over 4% on DJIA have widened Augusts’ average decline.
In post-election years, Augusts’ rankings are little changed. August is the worst month for DJIA and Russell 1000 and second worst for S&P 500, NASDAQ and Russell 2000. Average declines in post-election year Augusts swell to 0.8% by Russell 2000 to 1.7% by DJIA. Each index has also seen more declining post-election year Augusts than positive.
The first nine trading days of the month have exhibited weakness while mid-month is better. Note the bullish cluster from August 16 through 20. The end of August tends to be weaker when traders evacuate Wall Street for the summer finale. The last five days have declined in 13 of the last 25 years with the S&P 500 up only eight times on the penultimate day in the past 25 years. In the last 25 years, the last five days of August have averaged losses of: Dow Jones Industrials, –0.7%; S&P 500, –0.5% and NASDAQ, –0.04%. Since 2014, the last five days have been improving with only one loss by DJIA, S&P 500 and NASDAQ.
On Monday of expiration the Dow has been up 16 of the last 26 years with five up more than 1%, while on expiration Friday it has dropped in 7 of the last 11 years. Expiration week is down more than half the time since 1990, with some sizable losses; –2.6% in 1990, –2.3% in 1992, –4.2% in 1997, –4.0% in 2011, –2.2% in 2013 and –5.8% in 2015. The week after expiration is mildly stronger up 19 of the last 31.
|
August 2021 Strategy Calendar
|
|
By:
Christopher Mistal
|
July 22, 2021
|
|
|
|
|
Mid-Month Update: Worst Months Underway, Defense & Cash
|
|
By:
Christopher Mistal
|
July 15, 2021
|
|
|
|
Perfectly on cue our
Seasonal NASDAQ MACD Sell signal triggered on the last day of NASDAQ’s Mid-Year rally. Over the twelve-trading-day span that covers the last three trading days of June and the first nine of July, NASDAQ was up 2.0% this year. This is below average when compared to the past thirty-six years, but still a solid showing that extends the rally’s track record to up twenty-nine times in the last thirty-seven years. At NASDAQ’s Mid-Year rally high close on July 12, NASDAQ was up 2.6%, matching its average gain since 1985 before surrendering some of its gains during the last two days of the rally.
The appearance of NASDAQ’s Mid-Year rally is yet another sign that seasonality remains on track after getting overridden last year. The market is now entering its historically less favorable second half of July and the frequently treacherous August-September-October timeframe, aka the “Worst Four Months.” Even with the support of the Fed and Federal government spending, this year is not likely to be a repeat of last where the market sailed straight through this time period with only a few mild bumps and dips along the way.
In addition to concerns over Covid-19 variants, surging headline inflation metrics, interest rates, cyber-attacks and geopolitical events, bullish sentiment is still at concerning levels. According to
Investors Intelligence Advisor Sentiment survey released yesterday, bullish advisors have climbed to 61.2% while correction advisors dipped to 23.5% and bearish advisors declined to 15.3%. They noted that bearish advisors are at their lowest levels since early 2018. In that year bearish advisors fell all the way to 12.6% before the market corrected. The limited number of bears is justified by recent all-time record highs, but from a contrarian point of view it is an issue as it would seem that everyone that wants to own stocks already does.
We acknowledge elevated levels of bullish sentiment or the lack of bearish sentiment can persist for extended periods of time. There is no exact line in the sand that once crossed triggers a market pullback or a correction. But as the pace of gains slows and volatility begins to creep back into trading few remain waiting on the sidelines to “buy the dip.”
Another area of the market we have been watching closely (and others have begun to notice as well) is market breadth. We noted the
divergence in breadth last week in a blog post. In the time since that post the rift has only widened further. Thus far, DJIA and S&P 500 have largely been able to shrug it off, but small-caps measured by the Russell 2000 have been hit off 5.2% this month as of today’s close. NASDAQ has also weakened although not nearly as much, as mega-cap tech has held up and continued to climb. The downward trajectory of small-cap stocks and negative breadth in tech could easily pull the remainder of the market lower like it did in August and September 2019.
![[Advance-Decline Line Chart]](/UploadedImage/AIN_0821_20210715_AD_Line_Chart.jpg)
Yesterday’s Seasonal NASDAQ MACD Sell signal is confirmation to shift from the neutral positioning that was in our portfolios since our Seasonal MACD Sell for DJIA and S&P 500 on April 22 to fully cautious and defensive posture. The
Tactical Seasonal Switching Strategy ETF portfolio is now entirely in bond ETFs and cash. The
Sector Rotation ETF portfolio has also been trimmed back to contain mostly defensive positions or short trade ideas. The
Stock Portfolio has been taking profits, expanding its cash position and contains numerous defensive and/or dividend paying positions. All three portfolios are now positioned for the “Worst Four Months.”
Our outlook for the remainder of the year has not changed. We remain bullish for the full year but are cautious for the balance of the third quarter. Our best case scenario presented in the Annual Forecast is still on track and S&P 500 is still likely to finish the year in the 4300-4500 range or even higher. The pace of the gains made by the market and the economy is likely to slow as year-over-year comparisons become increasing more challenging and the trough low of the Covid-19 pandemic economic closure fades into history. At some point focus is going to shift from recovery to growth beyond the recovery. Sustained solid economic growth has proven to be rather sporadic over the last decade and this shift is more likely to hit the market sometime in midterm election year 2022.
|
NASDAQ Seasonal MACD Update
|
|
By:
Jeffrey A. Hirsch & Christopher Mistal
|
July 14, 2021
|
|
|
|
As of today’s close, the slower moving MACD “Sell” indicator applied to NASDAQ turned negative. At this time we are issuing our official MACD Seasonal Sell signal for NASDAQ.
NASDAQ’s “Best Eight Months” and Mid-Year Rally have come to an end. As a result, Sell PowerShares QQQ (QQQ). For tracking purposes, this position will be closed out of the Tactical Switching Strategy ETF Portfolio using its respective average price tomorrow, July 15.
Also consider adding to existing positions in iShares Core US Aggregate Bond (AGG) and Vanguard Total Bond Market (BND) on dips. Suggested buy limits:
AGG – $115.00
BND – $85.65
This NASDAQ Seasonal Sell Signal is a reminder to tighten stop losses and/or take profits on technology related positions as NASDAQ’s seasonally favorable period has come to an end. Russell 2000 exhibits a similar pattern to NASDAQ and small-cap positions could also be reviewed.
|
Stock Portfolio & NASDAQ Best Months Updates: On the Edge
|
|
By:
Christopher Mistal
|
July 08, 2021
|
|
|
|
Prior to today’s weakness,
NASDAQ’s Mid-Year Rally was off to a strong start. Over the last three trading days of June through yesterday’s close NASDAQ had rallied 2.1%. This compares favorably with the 12-trading day rally’s historical average gain of 2.6% since 1985. Prior to the official beginning of the Mid-Year Rally, NASDAQ began to rise just after mid-month in June. Recent strength and momentum have kept NASDAQ’s Seasonal MACD Sell signal positive. As of today’s close, it would take a one-day loss of 55.56 NASDAQ points (–0.38%) to turn its MACD indicator negative.
When NASDAQ’s MACD Sell indicator turns negative, we will issue our NASDAQ Seasonal MACD Sell signal and begin clearing out remaining technology and/or small-cap positions held in the Almanac Investor ETF Portfolios. Until that time, all related positions are on Hold.
Stock Portfolio Updates
Over the last four weeks since last update through yesterday’s close, S&P 500 climbed 3.3% higher while Russell 2000 dipped 3.2% lower. During the same time period the entire portfolio slipped 1.6% lower excluding dividends and any fees. Declines were spread relatively evenly across the entire portfolio. Mid-cap positions were the weakest, off 3.8%. Small caps were second worst, down 1.3% while Large-cap stocks eased 0.7%.
Much of the weakness in the Mid-cap portfolio can be attributed to JetBlue Airways (JBLU) and Taylor Morrison (TMHC). Both positions were stopped out shortly after mid-June when they closed below their respective stop losses. JBLU had been on thin ice for the past few months after topping in March. Even after selling half the original position in JBLU, it still recorded a 102.2% gain since addition last year in April. TMHC is a homebuilder and that sector has cooled overall as recent price and gross margin gains across the sector have likely peaked.
Algonquin Power (AQN) has slipped into the red (when its dividend is excluded). AQN is a utility but its primary focus is on renewable energy sources. Renewables are highly likely to continue to be an increasing slice of total energy production and consumption and AQN is investing heavily. Its recent $1 billion equity offering to finance or refinance investments in renewable energy projects demonstrates this but is also likely contributing to recent weakness. AQN’s long-term prospects appear favorable and its dividend is attractive.
Stepan Co (SCL) has also dipped into the red. The specialty chemicals and products produced by SCL are used by numerous sectors of the market. Weakness in housing and autos is likely having a spillover effect on SCL. But those are not the only sectors using its products. Last quarter’s earnings beat estimates and given their limited analyst coverage; it could easily happen again later this month.
Even after recent weakness, Small-cap positions are still the standout in the portfolio, up 81.4% on average. Recent weakness in banking and in housing has caused many positions to retreat from recent highs, but all remain well above original prices. Our small-cap standout continues to be Avid Tech (AVID), now up 177.5% since last November even after selling half the original position when it first doubled. AVID appears to be losing some momentum, but its relative performance still appears solid. AVID did trade lower today, but by less than either the NASDAQ or Russell 2000. Outsized gains in a rising market and muted losses in a weak market are two characteristics seldom exhibited by a single stock.
The other standout in the Small-cap portfolio over the past four weeks is North American Construction (NOA). Crude oil trading above $70 per barrel has likely contributed to NOA’s recent strength. NOA has weakened recently but traded at a new high in late June and was up 3% over the past four weeks through yesterday’s close and up 0.55% today.
Our Large-cap positions are largely from defensive or dividend paying sectors. With S&P 500 and NASDAQ closing at new all-time highs prior to today, defensive positions were not much in favor contributing a sizable portion of the portfolio’s modest decline.
DTE Energy (DTE) completed spinning of DT Midstream (DTM) on July 1. For every two shares of DTE held, shareholders received one share of DTM. Fractional shares are to be aggregated and sold with the proceeds to be distributed in cash. As a result of this spin off, DTE’s original price and stop loss have been adjusted. New shares of DTM appear at the bottom of the Large-cap portfolio for now.
Please see table below for specific stop losses and current advice for each position in the portfolio. All positions are on Hold. The market has enjoyed a specular run from last year’s bear market lows. The historically weak Worst Four Months will officially begin when we issue NASDAQ’s Seasonal MACD Sell signal which could occur any day now.
|
ETF Trades & NASDAQ Seasonal MACD Update: Transports, Industrials & Precious Metals
|
|
By:
Christopher Mistal
|
July 01, 2021
|
|
|
|
This July has commenced with across the board gains from the major indexes, DJIA, S&P 500, NASDAQ, Russell 1000 and Russell 2000. Today’s gains are consistent with historical trends for the first trading day of July. Over the past twenty-one years, July has on average begun with respectable gains. The second trading day has been weaker, but after this the major indexes have tended to trend solidly higher through mid-month to around the thirteenth trading day. At this point the major indexes have tended to weaken and trade sideways to lower to finish out the month.
July Sector Seasonalities
Three new sector seasonalities begin in the month of July. First up is a bearish seasonality in Transports which typically begins in the middle of July and lasts until the middle of October. This seasonality is based upon the Dow Jones Transportation index (DJT). Over the last 5-, 10- and 15-year time periods DJT has declined 2.4%, 3.2% and 4.2% on average during this weak timeframe. Industrials also exhibit similar weakness as the transports sector over nearly the same time period.
iShares Transportation (IYT) is a top choice to establish a short position in to take advantage of seasonal weakness in the transport sector. IYT has over $2 billion in assets, has traded an average of over 250,000 shares per day over the past 30 days and has a reasonable 0.42% expense ratio. IYT’s top five holdings include: FedEx, Kansas City Southern, Norfolk Southern, Union Pacific, and United Parcel Service.
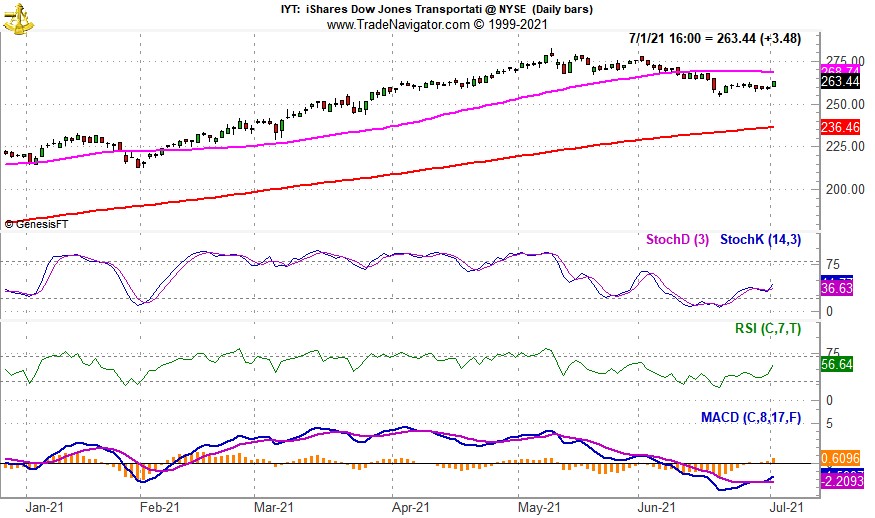
]
IYT appears to have peaked in the first half of May. It has been trending lower since and slipped below its 50-day moving average in the first half of June. Currently, Stochastic, relative strength and MACD indicators are beginning to turn, but it could be a false indication like what transpired in early June. IYT could be shorted near resistance around $268.73 or a breakdown below $255. If shorted, set an initial stop loss at $280.00, this level is just below the intra-day high in early May.
SPDR Industrials (XLI) will be our choice to establish a short position in to trade seasonal weakness in the industrial sector. XLI has over $19 billion in assets and frequently has over 10 million shares changing hands daily. Its expense ratio of 0.12% is very reasonable. Top five holdings include: Honeywell, United Parcel Services, Union Pacific, Boeing, and Raytheon Tech.
XLI’s chart and technical indicators do not differ much from the chart of IYT. XLI peaked around the same time as IYT and currently is trying to reclaim its 50-day moving average. XLI could be shorted near resistance around $103.50 or on a breakdown below $99.50. If shorted, set an initial stop loss at $106.00, this level is just above the intra-day high in early June’s failed breakout.
July’s final seasonality is from gold & silver mining stocks. This seasonality is based upon strength in the Philadelphia Gold & Silver index that typically begins in late July and lasts until late December. Over the last five years this trade has not been that successful however, over the last fifteen years the trade has averaged 4.7%. A three-pronged approach to this trade can be taken. In addition to a long positions in SPDR Gold (GLD) and iShares Silver (SLV) a position in VanEck Vectors Gold Miners (GDX) position is also suggested.
GDX had a tough June dropping from early month highs near $40 to less than $34. Relative strength, Stochastic and MACD indicators appear to be on the verge of turning positive. GDX could be considered near current levels up to a buy limit of $34.25. If purchased an initial stop loss at $32.54 is suggested. Take profits if GDX trades above $39.45.
SPDR Gold (GLD) and iShares Silver (SLV) are current holdings in the Sector Rotation ETF Portfolio. Additional purchases and/or new purchases could be considered on dips below a buy limit of $165.00 for GLD and $24.00 for SLV. We will maintain existing stop losses in the table below.
Sector Rotation ETF Portfolio Updates
With the exception of the trade ideas presented above, the balance of the Sector Rotation Portfolio is on Hold. Global X Copper Miners (COPX) and United States Copper (CPER) were both stopped out in mid-June. In the previous update stop losses for COPX and CPER had been raised as seasonal strength in copper historically has ended in May to early June. That is what appears to have transpired again this year. The average gain for the two positions was 25.3% excluding any trading costs or dividends.
With tight stop losses in place, SPDR Consumer Discretionary (XLY) and iShares DJ US Tech (IYW) moved higher throughout the month of June. XLY was up 17.3% at yesterday’s close while IYW was up 22%. XLY and IYW remain on Hold and their respective stop losses have been adjusted for recent gains.
Tactical Seasonal Switching ETF Portfolio Updates
As of today’s close, NASDAQ’s Seasonal MACD Sell has NOT triggered. Continue to Hold Invesco QQQ (QQQ). For NASDAQ’s Seasonal MACD to turn negative it would take a one-day decline of at 362.54 points (2.50%).
Defensive bond positions, AGG and BND, have firmed modestly since last update, but both can still be considered on dips below their respective buy limits. Headline inflation numbers have been elevated and well above the Fed’s target, but we generally agree that this is a transitory spike due to the economic shutdown last year. Moderating Treasury bond yields appear to confirm this.