|
Market at a Glance - 8/31/2023
|
|
By:
Christopher Mistal
|
August 31, 2023
|
|
|
|
Please take a moment and register for our member’s only webinar, September 2023 Outlook and Update on Wednesday September 6, 2023, at 2:00 PM EDT here:
Please join us for an Almanac Investor Member’s Only discussion of recent market action with time for Q & A at the end. Jeff will cover his outlook for September, review the Tactical Seasonal Switching Strategy ETF, Sector Rotation ETF, and Stock Portfolio holdings and trades. We will also share our assessments of the Fed, inflation, the "Worst Months" as well as relevant updates to seasonals now in play.
If you are unable to attend the live event, please still register. Within a day of completion, we will send out an email with links to access the recording and the slides to everyone that registers.
After registering, you will receive a confirmation email containing information about joining the webinar and a reminder message.
Market at a Glance
8/31/2023: Dow 34721.91 | S&P 4507.66 | NASDAQ 14034.97 | Russell 2K 1899.68 | NYSE 16000.37 | Value Line Arith 9442.99
Seasonal: Bearish. September is the worst DJIA, S&P 500, (since 1950) NASDAQ (since 1971) and Russell 2000 (1979) month of the year. Typically, bullish pre-election year strength does not help September as its ranking and performance remain at the bottom in pre-election years. End-of-Q3 portfolio restructuring has contributed to late-month weakness.
Fundamental: Not great. Q2 GDP was revised lower to 2.1% from 2.4% while July’s PCE was in line with expectations. Inflation’s trend lower is being challenged by an uptick in readings for July, but its broader trend appears to remain intact, but still above the Fed’s 2% target. Recent employment data hints of some modest cooling which is keeping the possibility of a soft economic landing alive. Oil above $80 per barrel and the Atlanta Fed’s GDPNow model forecasting growth over 5% in Q3 are two concerns. Both could impede the Fed’s inflation fight.
Technical: Bouncing. Market conditions were well set up for a mid-month bounce. DJIA, S&P 500 and NASDAQ had all retreated from their respective July/early August highs. The brisk retreat ended shortly after mid-month when support was found, and technical indicators were near or at oversold levels. The market could struggle as traders and investors look to avoid headline risk ahead of the 3-day Labor Day weekend.
Monetary: 5.25 – 5.50%. Recent comments from Fed officials indicate they are still very much concerned about inflation, but remain data driven. Currently the odds of another rate hike in September are essentially zero, but they are creeping higher for November’s meeting. The higher rates go, the more of a drag they will be on the economy and the market. 5%+ without the volatility of stocks is increasingly attractive.
Sentiment: Retreating. According to
Investor’s Intelligence Advisors Sentiment survey Bullish advisors stand at 43.1%. Correction advisors are at 36.1% while Bearish advisors numbered 20.8% as of their August 30 release. This is a marked decline in bullish sentiment since late July when bulls numbered 57.1%, but the number of bulls is still high compared to historical levels seen around the better buying opportunities.
|
September Outlook: Inflation Done Cooling Watch Out for September Surprise
|
|
By:
Jeffrey A. Hirsch & Christopher Mistal
|
August 31, 2023
|
|
|
|
While we are still bullish for the rest of 2023 overall and maintain our
best-case scenario is still in play, we are not convinced everything is fixed just yet in the near term. The recent rally off the August lows has not brought us back to the previous highs. There has been much discussion in both mainstream and social media about the seasonal weakness in August and September that we have warned you about for some time.
August has delivered on its promise of weakness, driving DJIA down -2.4%, S&P -1.8%, NASDAQ -2.2% and Russell 2000 lost 5.2% at the close of the month today. At their respective August correction lows earlier in the month all the indices were down further: DJIA -4.1%, S&P -4.8%, NASDAQ -7.4% and R2K -7.8%.
There have been some stats bandied about how a down August in the face of strong year-to-date gains is a positive sign for September. There is also the question of if an August correction has any significant effect on September weak seasonality and the infamy as the worst month of the year. So, we ran the numbers.
Of the 33 down Augusts on the S&P 500 since 1950, 17 were followed by down Septembers – just about 50/50. September averaged a loss in all 33 years of -0.65%. October was up in 20 of those years, boasting an average gain for all 33 years of 2.25%. For the last four months of the year, September-December, was positive in 26 of the 33 years for an average gain of 5.10%. Twenty-one of the 33 full years were up with an average gain of 8.31%.
Within this down August dataset are those seven years that folks are talking about where the S&P was up 15% or more year-to-date at the end of August and August was down. Yes, 6 of the 7 following Septembers were up, but 5 of the 7 following Octobers were down. One of the down Octobers followed the one down September in 1975 and the other was 2019 after August and September were net flat. Ironically, 5 of the 7 were pre-election years. So, we might have a good September, but if we do, the odds are high we’ll have a rocky October.
![[7 august ytd >15%]](/UploadedImage/AIN_0923_20230831_SP500_Down_August_YTD-gain_After_mini_table.jpg)
You really can see it on the updated seasonal pre-election year charts of S&P 500 and NASDAQ. Seasonal weakness is likely to continue through October fueled by inflation data and confusing Fed-speak, in addition to the normal perennial forces that pressure stock prices lower. The October 31 deadline for funds to reconcile accounting, Q3 institutional window dressing and retail investor fear is likely to perpetuate September-Octoberphobia. Collective repetitive seasonal behavior from market participants can fan the flames of any minor shocks.
![[NASDAQ Pre-Election Year Seasonal Chart]](/UploadedImage/AIN_0923_20230831_NASDAQ_Pre-Election_STAAC_Seasonal_Chart_900.jpg)
![[S&P Pre-Election Year Seasonal Chart]](/UploadedImage/AIN_0923_20230831_S&P500_Pre-Election_STAAC_Seasonal_Chart_900.jpg)
We do not anticipate any major selloff and expect new highs around yearend. But we do expect some sort of surprise to send stocks into another mild correction before the Q4 rally ensues. Nobody wants to talk about it or hear about it, but inflation appears to be done cooling. The big three inflation metrics, CPI, PPI and PCE all ticked higher this month. CPI and PCE are both at about 3.3%. We have argued before that 3.3% is the historical average inflation metric despite the Fed’s stated goal of 2.0%. Any further hints at higher inflation will likely heat up the “higher-for-longer” chatter and weigh on stocks.
We are also concerned that we are poised for a September surprise in the financial sector. We would not be shocked if one of the rating agencies comes out next month and announces a host of bank downgrades, perhaps starting at the top with a big bank. They did warn us back in March during the banking scare and most recently with the Fitch downgrade of the US credit rating.
Either way, we expect any weakness to be temporary and for the market to continue to track the seasonal patterns illustrated above. So, keep your powder dry until October and our Best Months Seasonal MACD Buy Signal. After any September/October weakness the most likely course of action is a yearend rally and positive 2024. Our early handicapping suggests gains of 8-12% for the main indices in 2024 fueled by the power of a sitting president running for reelection. We’ll discuss this further as we get closer to the new year.
Pulse of the Market
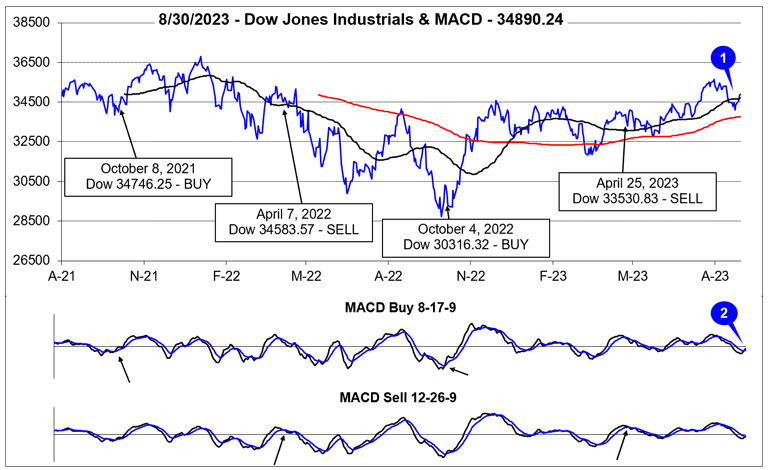
DJIA’s breakout to new recovery highs was cut short by typical seasonal weakness in August (1). DJIA retreated below its 50-day moving average just after mid-August before finding support late last week at the top of the range it had been stuck in for nearly six months. DJIA has since rebounded back above its 50-day moving average this week. The shift in momentum has been confirmed by the faster moving MACD Buy indicator (2), but not confirmed by the slower moving MACD indicator.
After advancing in three of four weeks in July, DJIA has declined in three of the last four weeks in August (3). Despite this, DJIA has not recorded a single Down Friday/Down Monday (DF/DM) occurrence since June which suggests traders and investors remain confident, perhaps more than some sentiment readings suggest. S&P 500 (4) & NASDAQ (5) were down three straight weeks to start August. The last time both were down three or more weeks in a row was in December 2022. That four-week losing streak was followed by five straight weekly gains by NASDAQ and four out of five by S&P 500. A similar outcome this time seems unlikely as seasonality does not favor the indexes now as it did back in January.
Unsurprisingly, market breadth over the last five weeks has been in line with weekly moves. NYSE Weekly Decliners swelled during down weeks and reached a peak (6) over 2500 during the week ending August 18. Historically, that level has coincided with shifts in sentiment and occurred at or near oversold levels. The market has rallied since then, but it remains to be seen if the seasonal pullback has run its full course.
Weekly New Highs and New Lows were also in line with expectations. One potential concern is New Highs sunk even further and New Lows continued to expand last week even as the indexes rebounded (7). This would appear to suggest limited participation in the rally. If this week’s numbers fail to show improvement, then the rally could be just a relief bounce.
Both the 90-day Treasury and 30-year Treasury yields continued to inch higher over the last five weeks (8). The 90-day Treasury yield is at its highest level since early January 2001 while the 30-year Treasury yield has broken above last year’s highs and is now at its highest level since May 2011. The higher rates go, the more pressure they will put on stocks. A relatively safe 5% yield looks even more attractive when stocks are just bouncing around in a range.
Click for larger graphic…
|
September Almanac: No Relief in Pre-Election Years for Worst Month
|
|
By:
Jeffrey A. Hirsch & Christopher Mistal
|
August 24, 2023
|
|
|
|
Start of the business year, end of summer vacations, and back to school made September a leading barometer month in first 60 years of 20th century, now portfolio managers back after Labor Day tend to clean house. Since 1950, September has been the worst performing month of the year for DJIA, S&P 500, NASDAQ (since 1971), Russell 1000 and Russell 2000 (since 1979). September was creamed four years straight from 1999-2002 after four solid years from 1995-1998 during the dot.com bubble madness. More recently, S&P 500 has been down in six of the last nine Septembers. September gets no respite from positive pre-election year forces.
![[Pre-Election Year September Performance Table]](/UploadedImage/AIN_0923_20230824_September_pre-election_year_mini_table.jpg)
Although the month used to open strong, S&P 500 has declined nine times in the last fifteen years on the first trading day. With fund managers tending to sell underperforming positions ahead of the end of the third quarter there have been some nasty selloffs near month-end over the years. Recent substantial declines occurred following the terrorist attacks in 2001 (DJIA: –11.1%), 2002 (DJIA –12.4%), the collapse of Lehman Brothers in 2008 (DJIA: –6.0%), U.S. debt ceiling debacle in 2011 (DJIA –6.0%) and in 2022 (DJIA –8.8%).
![[Recent 21-Year September Seasonal Pattern Chart]](/UploadedImage/AIN_0923_20230824_September_2023_Seasonal.jpg)
September Triple Witching week is generally bullish with S&P 500 advancing nearly twice as many times as declining since 1990 but is has suffered some sizable losses and been down four or five years in a row depending on index. Triple-Witching Friday was essentially a sure bet for the bulls from 2004 to 2011 but has been a loser eight or nine of the last eleven years, depending on index with S&P 500 weakest, down ten of the last eleven. The week after Triple Witching has been brutal, down 26 of the last 33, averaging an S&P 500 loss of 1.01%. In 2011, DJIA and S&P 500 both lost in excess of 6%.
Labor Day has become the unofficial end of summer and the three-day weekend has become prime vacation time for many. Business activity ahead of the holiday was more energetic in the old days. From 1950 through 1977 the three days before Labor Day pushed the DJIA higher in twenty-five of twenty-eight years. Bullishness has since shifted to favor the Wednesday after the holiday as opposed to the days before. DJIA has gained in 21 of the last 28 Wednesdays following Labor Day. Tuesday after Labor Day also leaned bullish, but DJIA has declined on 11 of the last 15.
|
September 2023 Strategy Calendar
|
|
By:
Christopher Mistal
|
August 24, 2023
|
|
|
|
|
Mid-August Update: Rising 10-Year Treasury Yield Pressures Market
|
|
By:
Christopher Mistal
|
August 17, 2023
|
|
|
|
Early August weakness has persisted, and mid-August’s usually seasonal favorable period has been overridden. The S&P 500 was down on all three of its bullish days this week. Although not the greatest or most significant seasonal trend or pattern out there, the absence of strength during this usually bullish period is a concern. As of today’s close, DJIA is down 3.1%, S&P 500 is off 4.8% and NASDAQ is down 7.2% in August. From their respective closing highs, losses are modestly bigger, but still less than the 10% typically used to define a correction.
![[August Seasonal Pattern Chart]](/UploadedImage/AIN_0923_20230817_Seasonal_August_Update.jpg)
In the above updated (as of 8/17/2023 close) August Seasonal Pattern Chart comparing Pre-election Years (right axis) to 2023 (left axis) the lack of the usual mid-month strength this year is clear. Going forward August’s pattern suggests continued weakness and volatility before a modest rebound just ahead of the end of the month. Even if late-August strength does materialize, it is not likely to persist during the historically weakest month of the year, September.
![[S&P 500 Pre-Election Year & STAAC Chart]](/UploadedImage/AIN_0923_20230817_Pre-Election_STAAC_Seasonal_Chart.jpg)
Even though mid-August strength was overridden, the S&P 500 continues to track applicable full-year seasonal patterns closely this year. This chart also suggests continued weakness and volatility lasting possibly until late October. Looking at S&P 500’s pullback in February and March of this year when it went from well above average to below average pre-election performance suggests the current pullback could be around the halfway point. At the S&P 500’s late July peak, numerous excesses had accumulated. Valuations were stretched in many segments of the market, sentiment had reached frothy levels, and technical indicators were overbought. Some progress has been made unwinding those, but more remains to be done.
One of our
concerns from our March member webinar has reemerged. The 10-year Treasury bond yield has climbed back near levels last seen in October when the S&P 500 bottomed out and 2022’s bear market came to an end. The intra-day high of 4.33% for the 10-year Treasury was nearly reached today. A breakout above this level and higher will add significant pressure to the market. It will also drive mortgage rates even higher putting further pressure on real estate. Of even greater concern is the potential impact on the banking sector as many of the biggest banks could face a rating cut. Fitch reminded everyone earlier this week of the possibility. Whether it occurs or not remains to be seen.
The main driver of the higher 10-year Treasury yield is inflation remaining stubbornly above the Fed’s 2% target and signs that it may accelerate. July’s CPI and PPI reports both showed modest upticks, but the reports also did not capture the full increase in gasoline prices we have been seeing at the pump. It is also worth noting that July’s CPI 12-month change was reported wrong nearly everywhere due to an error in the
BLS press release that remains uncorrected. Going to the data on the BLS website reveals that 12-month CPI was up 3.3% in July, not the 3.2% reported in the press release and subsequently quoted nearly every other place.
![[12-month CPI Projection Chart]](/UploadedImage/AIN_0923_20230817_CPI_Projection.jpg)
Plugging July’s CPI reading into the above updated projection chart results in the odds of the Fed meeting its 2% target remaining dismally low. The only month-over-month change that gets CPI under 2% is 0.1% or less. And even then, it will not be reported until February 2024. Solid employment data and accelerating economic growth only add further pressure to rising prices and inflation data. The
Atlanta Fed’s GDPNow model is forecasting Q3 growth of 5.8% as of its most recent update on August 16.
The clarity that the market seeks on interest rates simply does not exist yet. The solid trend of inflation easing has turned murky, and the Fed could be forced to raise rates yet again and/or hold rates higher for longer. The market is also in the middle of the historically weakest 2-month span, August through September. Our outlook for the remainder of the quarter and the year remains the same. More volatility and chop are expected through the rest of August and September. A Q4 rally into the New Year is also still in play.
|
August Weakness & Stock Portfolio Update: More Volatility in Worst Months
|
|
By:
Christopher Mistal
|
August 10, 2023
|
|
|
|
It would seem the fear of August-September weakness is becoming a self-fulfilling prophecy. Today’s inline to better than anticipated CPI reading for July did initially lift the market, but a touch of reality set in shortly afterwards as the major indexes spent most of the day slowly giving back the early gains. Although CPI was inline, the 12-month change in inflation did move higher to 3.3%. Curiously, the energy component of July CPI did not seem to reflect the change in pump prices that I observed in my travels in July. Perhaps it will appear in PPI or this month’s data.
Despite modest gains at today’s close by DJIA, S&P 500 and NASDAQ, all the major indexes we track are down over the first eight trading days of August. As of today, NASDAQ has been the weakest, off 4.24% this month. Russell 2000 is the second weakest, down 4.02%. S&P 500 has slipped 2.62% while DJIA is down 1.08%. Compared to past pre-election year August performance since 1950, this August has tracked closely. Should the market continue to track the historical pre-election year August pattern, a mid-month bounce could begin soon. This historical mid-month move is shaded in yellow in the following chart.
![[Pre-Election Year August Seasonal Pattern Chart]](/UploadedImage/AIN_0923_20230810_August_Pre-election_Seasonal.jpg)
However, the mid-month rebound does tend to fade by the fourteenth trading day (August 18, 2023) with more choppiness and volatility through the end of August and into September. We maintain our cautious outlook for the remainder of the “Worst Months.” Inflation has cooled, but the Fed’s 2% target still appears distant. Long-term interest rates are rising, adding additional pressure on real estate. Energy prices are climbing, and geopolitical concerns remain numerous and growing.
Stock Portfolio Updates
Over the last four weeks since the last update through yesterday’s close (August 9), S&P 500 and Russell 2000 both slipped 0.1% lower. Over the same period the entire portfolio climbed 0.01% higher, excluding dividends, any interest on cash and any trading fees. Our remaining two small-cap positions were responsible for most of the entire portfolio’s modest gain, advancing 8% on average. Large-cap positions slipped 0.2% lower overall, dragged lower by continued weakness in AT&T Inc. (T). Mid-caps also declined 3.1% when compared to the last update.
AI-related stocks, Super Micro Computer (SMCI) and Axcelis Technologies (ACLS) extended their bullish runs through July but ran into profit taking this month. ACLS was first to succumb on August 1. SMCI extended its run until earlier this week, August 7, reaching an all-time intra-day high of $357 that day. At their respective highs, adjusted for selling half on a double, SMCI was up 217.9% and ACLS was up 131.9%. SMCI and ACLS were modestly higher today and remain on Hold. It remains to be seen if their AI-fueled run has come to an end yet or if recent declines were just an aggressive bout of profit taking.
UnitedHealth Group (UNH) did deliver last month when it reported earnings. Shares jumped over 7% on July 14, reclaiming their stop loss. Traditionally defensive sectors like healthcare have been under pressure as interest rates have risen. Should inflation continue to moderate, interest rates are likely to do the same and UNH could once again become more attractive. UNH is on Hold.
All positions not previously mentioned are on Hold. The worst two-month span, August through September is here. Historical first half of August weakness arrived on cue this year. More weakness and volatility are possible as September and the end of Q3 approaches.
|
ETF Trades: Hot Julys and Subsequent Declines
|
|
By:
Christopher Mistal
|
August 03, 2023
|
|
|
|
In case you missed the member’s only webinar on Wednesday, the slides and video recording are available
here (or copy and paste in a new browser window:
https://www.stocktradersalmanac.com/LandingPages/webinar-archive.aspx). In the webinar we reviewed key seasonal pattern charts that we have been tracking throughout the year, current GDP and inflation trends, Fed interest rate expectations, the surge in 10-year Treasury rates, the U.S. credit rating downgrade and what we expect during the balance of the “Worst Months.”
We also presented the history of past “Hot Julys.” We defined a “Hot July” as any month with a gain of 3% or more. For DJIA, every “Hot July” since 1950, was followed by a retreat that averaged 6.9% from July’s close to a subsequent closing low in the second half. The worst decline was 32.4% in 1987 while the mildest DJIA decline was 0.1% in 1958. The conclusion is “Hot Julys” have led to better Autumn buys as many of the subsequent lows occurred in September and October.
![[DJIA Hot July Table]](/UploadedImage/AIN_0923_20230803_Hot_July_Table_DJIA.jpg)
Appling the same approach to S&P 500 and NASDAQ yielded similar results. S&P 500 and NASDAQ experienced subsequent average declines of 6.2% and 5.5% respectively. S&P 500 also experienced its worst decline in 1987. NASDAQ was not up 3% or more in July 1987. NASDAQ’s worst subsequent decline after a “Hot July” was 1973. After rising 12.3% in July 2022, NASDAQ fell 17.6% from its July close to its low on December 28, its second worst decline. For S&P 500 and NASDAQ, each had one “Hot July” that was not followed by a decline, 1958 for S&P 500 and NASDAQ it was in 1980.
This further reinforces our
outlook for the balance of the “Worst Months.” Potential catalysts for a pullback and or correction include rising long-term interest rates, rising crude oil price putting pressure on down trending inflation metrics that could force the Fed to remain hawkish longer, and geopolitical concerns.
New Trade Ideas Based Upon August Sector Seasonalities
Although two new bullish sector trades begin in August, we are going to take a cautious approach. New long trade ideas are suggested on dips. If they do not dip below their respective buy limits, that is fine as we can consider again when the “Worst Months” end. This is consistent with our near-term view that the market is likely to endure some additional weakness during the balance of the third quarter and possibly into early Q4 before rallying again to finish the year.
The biotechnology sector enters its historical favorable season in August. iShares Biotech (IBB) could be considered on dips below a buy limit of $123.50. A stop at $119.90 is suggested. The auto-sell price is $154.97 based upon historical average performance. A 17.5% average gain has occurred over the last 25 years while an average gain of 8.5% has occurred in the most recent 5 years. Top five holdings are: Vertex Pharmaceuticals, Amgen, Gilead Sciences, Regeneron Pharmaceuticals, and IQVIA Holdings.
SPDR S&P Biotech (XBI) can also be considered on dips below $77.50. XBI’s top five holdings include: BridgeBio Pharma, Revolution Medicines, Halozyme Therapeutics, ACADIA Pharmaceuticals, and Catalyst Pharmaceuticals. Compared to IBB, XBI’s holdings tend to be small-cap, growth-orientated holdings. Due to this XBI can exhibit more volatility compared to IBB.
Over the last 25 years, Info-Tech has generated an average return of 11.9%, and for the last five years the average has been a solid 13.6% during its bullish season from mid-August to mid-January. Our top ETF within this sector is iShares DJ US Technology (IYW). Set a buy limit of $101.50 and an initial stop loss of $93.53 if purchased. Should high-tech produce above average gains, profits can be taken at the auto-sell price of $136.29. IYW’s top five holdings are: Apple, Microsoft, Alphabet Class A & C shares, Nvidia, and Meta. These five holdings represent 53.22% of IYW’s total holdings.
![[iShares DJ US Tech (IYW) Daily Bar Chart]](/UploadedImage/AIN_0923_20230803_IYW.jpg)
August’s final new trade idea is a short trade in the Semiconductor sector. Over the past 25 years the Semiconductor index (SOX) has declined on average 7.7% from the middle of August through the end of October. More recently, over the last five years this trade has not been all that successful with an average 0.1% gain. AI expectations have fueled the sector substantially higher, but consumer-based product demand like PCs and smartphones appears to be slumping. Today’s disappointing forecast from Qualcomm could be just the beginning of broader sector weakness.
We are going to avoid using a leveraged, inverse ETF and instead consider establishing a short position in iShares Semiconductor (SOXX) on a breakdown below $498.96. If shorted on a breakdown set an initial stop loss at $523.91. Top five holdings of SOXX are: Nvidia, Broadcom, Advanced Micro Devices, Intel, and Texas Instruments.
Sector Rotation ETF Portfolio Updates
The summer doldrums and the worst two-month span (August-September) of the year have arrived. The market has begun to exhibit some seasonal weakness after a “Hot July”. Last month’s trade ideas shorting the transport and industrial sectors have not been added to the portfolio. iShares Transportation (IYT) can still be shorted on a breakdown below $252.69. SPDR Industrials (XLI) can also still be considered on a breakdown below $108.78. The rebound in crude oil in July appears to have not yet impacted either IYT or XLI. For tracking purposes, IYT and XLI will be added to the portfolio if they close below their respective breakdown prices.
Rising long-term interest rates have put modest pressure on our “Worst Months” defensive positions, XLP, XLV and XLU. Continue to hold these positions mindful of their stop loss prices.
Tactical Seasonal Switching Strategy Portfolio Update
Rising long-term yields have pressured TLT, AGG and BND. These positions are officially half positions originally established in April. Since issuing our
Seasonal MACD Sell for NASDAQ, our preference has been short-term bond ETFs like or similar to SHV and SGOV. Money market funds are also acceptable choices should your options be limited.
SHV and SGOV can still be considered at current levels.
As a reminder, many sites and data sources will display a trailing 12-month yield for SHV and SGOV. This may not reflect present yields as interest rates were not at their present levels one year ago. The 30-day SEC yield found on the issuer’s website should be more reflective of current yields and can be found by visiting
https://www.ishares.com/us. Dates for dividends can also be found at the site.
Disclosure note: Officers of Hirsch Holdings Inc hold positions in AGG, BND, SGOV, SHV & TLT in personal accounts.