|
Market at a Glance – August 27, 2026
|
|
By:
Christopher Mistal
|
August 27, 2026
|
|
|
|
Please take a moment and register for our members’ only webinar, September 2026 Outlook & Update on Wednesday September 2, 2026, at 4:00 PM EDT here:
Please join us for an Almanac Investor Member’s Only discussion of recent market action with time for Q & A at the end. Jeff and Chris will cover their outlook for September 2026, review the Tactical Seasonal Switching Strategy ETF, Sector Rotation ETF, and Stock Portfolio holdings and trades. We will also share assessments of the Iran war, economy, the Fed, inflation, geopolitical events, gold, copper, energy, and relevant updates to seasonals now in play.
If you are unable to attend the live event, please still register. Within a day of completion, we will send out an email with links to access the recording and the slides to everyone that registers.
After registering, you will receive a confirmation email containing information about joining the webinar and a reminder message.
Market at a Glance
8/27/2026: Dow 53569.44 | S&P 7730.99 | NASDAQ 26541.35 | Russell 2K 3014.34 | NYSE 24649.03 | Value Line Arith 14328.98
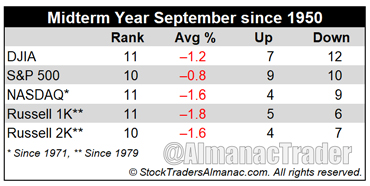
Seasonal: Bearish. September is the worst performing month of the year for DJIA, S&P 500, NASDAQ (since 1971), Russell 1000 and Russell 2000 (since 1979). September’s rank improves modestly in midterm years going back to 1950, but average losses widen for DJIA (–1.2%), NASDAQ (–1.6%), Russell 1000 (–1.8%) and Russell 2000 (–1.6%). S&P 500’s average September loss in all years is unchanged at –0.8% in midterm years. DJIA has declined in 12 of the last 19 midterm-year Septembers.
Fundamental: Mixed. Despite the Atlanta Fed’s GDPNow model currently showing Q3 GDP estimated at 4.6%, Q2 GDP revised was just 1.5%, well below earlier estimates by the same model. Mixed economic growth has not caused inflation to slow as core CPI came in 3.4% higher than one year ago period. AI investment remains robust, but concerns about the spending spree remain. Employment data appears to be holding up, but the size of the U.S. labor force is falling and nonfarm payrolls declined by 23000 in July.
Technical: Breakout Fading. DJIA, S&P 500, and Russell 2000 closed at new all-time highs in August. NASDAQ has not. After the early August breakout all four indexes are back above their respective 50-day moving averages, but the gap has been narrowing, today notwithstanding. Current levels of support to watch are DJIA around 52500, S&P 500 near 7500, NASDAQ 26000, and Russell 2000 approaching 2990.
Monetary: 3.50 – 3.75%. To hike or not to hike. As of 4:30 pm EDT on August 27, the
CME Group’s FedWatch Tool is showing odds that suggest no change in Fed funds target rate until at least their December 9, 2026, meeting where the odds reach 74.5%. The Fed may be on the sidelines until later this year, but the U.S. Treasury will be acting in September in an attempt to lower long-term Treasury bond yields by doubling its buyback program. Treasury will begin purchasing bonds of 10-year and longer duration on September 9 with at least $4 billion per operation. It remains to be seen what the real-world impact will be on bond yields and interest rates. We suspect it will likely be muted given the substantial dollar amount of bonds outstanding compared to the buyback amount.
Sentiment: Bulls Stretched. According to
Investor’s Intelligence Advisors Sentiment survey Bullish advisors stand at 51.9%. Correction advisors are at 30.8%, and Bearish advisors were 17.3% as of their August 26 release. Two weeks ago, Bullish advisors peaked at 57.4%, their highest level since late February. Overall sentiment suggests the majority of funds marked for the market are already invested and little remains on the sideline. If that is the case, the market is likely still highly suspectable to headline risk especially the longer it takes NASDAQ to return to new all-time highs.
|
September Outlook: Wake Me When September Ends
|
|
By:
Jeffrey A. Hirsch & Christopher Mistal
|
August 27, 2026
|
|
|
|
As summer winds down and the days grow shorter, investors often find themselves humming a familiar tune—not Green Day’s classic, but rather a cautious melody anticipating September’s historical market tendencies. After a remarkably strong year-to-date performance that has largely tracked our annual forecast, the market stands at a crossroads. As Wall Street navigates its toughest month on the calendar amid persistent inflation and Fed uncertainty, the central question arises: will September bring a much-needed “pause that refreshes,” or will it end the market’s hot streak?
The market has enjoyed an impressive run, defying many early-year anxieties. Yet, as we approach the notorious September–October seasonal corridor, a healthy dose of caution is warranted. While we remain cautiously bullish for the balance of 2026, the historical weakness of these months commands respect. With Wall Street’s eyes trained on the Fed’s annual Jackson Hole Economic Policy Symposium, the FOMC’s delicate dance with stubborn inflation, and messaging under the new Warsh Fed regime, unmistakable similarities to the 2018 market environment are emerging. Crucially, both 2026 and 2018 are midterm election years under a Trump administration.
In the accompanying charts of NASDAQ and S&P 500 Seasonal Patterns, we have overlaid 2018 for comparison. The analogs are striking: 2026’s market trend, trajectory, and performance to date are tracking 2018 almost step-for-step.
During President Trump’s first midterm year (2018), the market established a March low driven by tariff announcements and escalating trade war friction with China, which hammered trade-sensitive blue chips and sparked a tech selloff. From there, the typical Trump-era momentum kicked in, propelling the market to new highs by August before consolidating sideways through September and tagging marginal new all-time highs in late September/early October. The Fed then orchestrated the infamous “Christmas Eve Crumble” by hiking rates in December and spooking markets with rigid guidance—most notably when Fed Chair Powell remarked during his December 19 press conference that balance sheet runoff (quantitative tightening) was on “autopilot.”
With the market currently looking somewhat extended against a backdrop of sticky inflation and a murky, newly transitioning Fed regime, this historical Trump midterm script gives us pause. Should the market manage to sidestep an immediate September slide, any significant weakness is more likely to manifest as a late-year correction rather than a typical September selloff. Consequently, we maintain a cautiously bullish near-term stance while keeping a close eye on the calendar risks ahead.
Zooming in on August alone further highlights and reinforces the prevalence of the Trump cycle pattern. As shown in the chart below tracking August market performance under Trump presidency years—specifically 2018—the market has adhered closely to this rhythm.
Beneath the surface, the technical backdrop is showing signs of fatigue. The DJIA and S&P 500 staged bullish breakouts to fresh highs this month, with the S&P resolving upward out of its neutral symmetrical triangle continuation pattern. The Russell 2000 also notched new highs and remains the year’s top performer among the four major benchmarks, though it has cooled over the past three months in line with typical small-cap summer seasonality. In contrast, NASDAQ has failed to confirm with new highs and has now gone 60 trading days without a fresh all-time high.
Furthermore, as illustrated in the technical charts below, the early-August breakout momentum appears to be waning. We have outlined key near-term support levels with thicker red lines near the early-August breakout gaps, late spring/early summer highs, and consolidation zones around S&P 7500, DJIA 52500, and NASDAQ 26000.
Our playbook: respect September’s notorious track record for pullbacks and late Q3 turbulence, and use any seasonal weakness as an entry point to capitalize on the fourth-quarter rally and the impending Sweet Spot of the 4-year cycle (midterm Q4 through pre-election year Q2). However, if the market shrugs off seasonal headwinds and powers higher through September, keep your antennae up for late-arriving “Octoberphobia” and a potentially rocky year-end similar to 2018.
Pulse of the Market
On the heels of a below average midterm-year July (+0.3% this year versus 1.6% in all midterm Julys since 1950), DJIA surged higher over the first three trading days of August to its most recent all-time closing high (1) on August 5 at 54349.12. However, DJIA’s thrust into August quickly ended as interest rate, inflation, and geopolitical concerns reclaimed the headlines. DJIA strength has returned after it found support just above its 50-day moving average on August 20.
DJIA’s loss of positive momentum after closing at new all-time highs in early August was confirmed by both the faster and slower moving MACD indicators (2). Both MACD indicators turned negative in mid-July and have remained so since. DJIA gains this week have slowed MACD’s negative momentum, but more will be needed before MACD can reverse course and confirm DJIA’s change in its short-term trend. Should DJIA’s strength this week fade, MACD would likely resume its course back toward and possibly below the zero line. This would be an ideal setup for DJIA’s Seasonal MACD Buy signal to occur sometime on or after October 1.
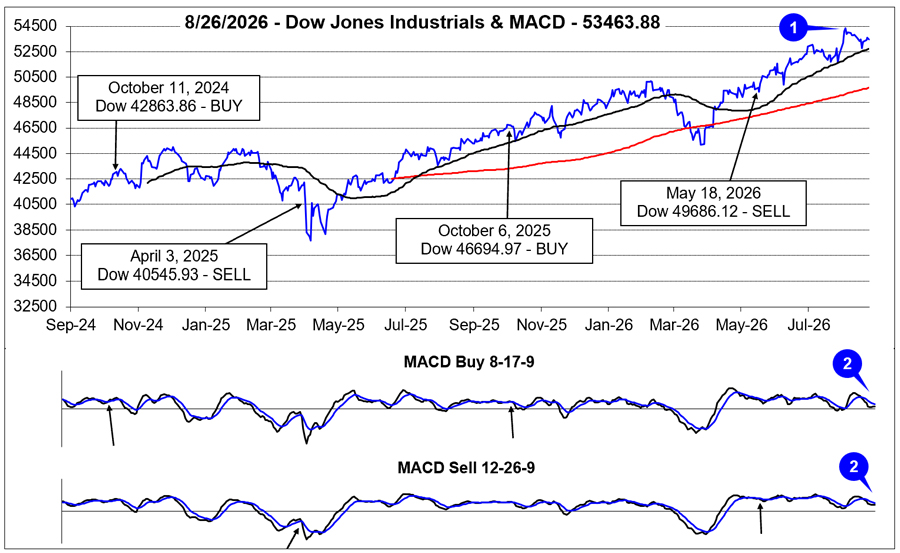
After August’s strong first week start, DJIA and the market in general, did pause to consolidate those gains. This was also around the time when the 30-year Treasury bond yield was near multi-decade highs as the national debt topped $40 trillion. This was enough to inject some additional concerns in traders and investors that resulted in DJIA’s seventh Down Friday/Down Monday (DF/DM) warning of 2026 (3) (page 78, STA 2026). Thus far this year, DJIA DF/DM occurrences have seen little downside follow through. Given the longer-term, less sanguine history of DF/DMs, this recent mid-August occurrence still merits caution.
Following three weekly gains in a row, S&P 500 (4) and NASDAQ (5), declined 1.4% and 2.1% respectively last week (week ending August 21). DJIA also fell 0.8% in the week. As of today’s close, August 27, that weekly decline is not likely to become a new losing streak. Late August gains have been common over the last 21-years but September is still the worst month of the year.
Despite DJIA, S&P 500, and Russell 2000 all closing at new all-time highs in August, market breadth (6) has been somewhat lackluster. In the first week of August, when DJIA, S&P 500 and NASDAQ all gained 3% or more, the ratio of Weekly Advancers to Weekly Decliners was just 1.65. Historically, gains of that magnitude have far more Advancers and the ratio has generally been above 2.00. As the number of Weekly Advancers retreats, the result is likely to be smaller and/or limited gains. Possibly more important to watch is Weekly Decliners. Should their number begin to trend higher, broad market weakness could ensue.
New 52-week Highs and Lows (7) are a minor concern. Even with new all-time highs by the indexes in August, New 52-week Highs peaked at just 312 while New 52-week Lows have climbed to 259 (as of week ending Aug 21), their highest level since late March as the market bottomed. If this trend of tepid New 52-week Highs and expanding New 52-week lows persists, the market could be set up for a modest pullback. This aligns well with the weak seasonality of September.
On a weekly basis, the 30-year Treasury bond yield (8) reached its highest level last week since June 2007. In the nearly 20 years that separate those two readings, the 30-year Treasury bond yield averaged just 3.44%. The increase in long-term yields is being driven by persistent inflation and massive Federal deficits and debt. If Treasury bond yields and interest rates can stabilize, the impact to the economy and the market is likely to be manageable. The Fed and U.S. Treasury will certainly be trying their best to ensure that outcome.
Click for larger graphic…
|
September 2026 Almanac: Losses Expand in Midterm Years
|
|
By:
Jeffrey A. Hirsch & Christopher Mistal
|
August 20, 2026
|
|
|
|
It runs Oct. 5-7 at the Hilton Orlando Lake Buena Vista; a new venue steps from Disney Springs® and Orlando's theme park district.
(https://www.orlandomoneyshow.com/registration/?scode=067844)
More information can be found below.
September Almanac
Portfolio managers returning from vacation after Labor Day have tended to clean house in September. Since 1950, September has been the worst performing month of the year for DJIA, S&P 500, NASDAQ (since 1971), Russell 1000 and Russell 2000 (since 1979). September was creamed four years straight from 1999-2002 after four solid years from 1995-1998 during the dot.com madness. More recently, DJIA, S&P 500, NASDAQ, Russell 1000 and 2000 have been down seven of the last twelve Septembers and four of the last six. Average losses over the last twelve years range from –1.0% by DJIA to –2.0% from Russell 2000.
September’s overall rank improves modestly in midterm years going back to 1950, but average losses widen for DJIA (–1.2%), NASDAQ (–1.6%), Russell 1000 (–1.8%) and Russell 2000 (–1.6%). S&P 500’s average September loss in all years is unchanged at –0.8% in midterm years. Hefty declines in September 1974, 2002, and 2022 do weigh on the average decline. Even so, DJIA has declined in 12 of the last 19 midterm-year Septembers.
Although the S&P 500 has advanced 18 times over the last 30 years on September’s first trading day, strength has become rather intermittent more recently with average performance over the last 21 years turning negative (–0.19%). With managers tending to sell underperforming positions ahead of the end of the third quarter there have been some nasty selloffs near month-end over the years. Recent substantial full-month declines occurred following the terrorist attacks in 2001 (DJIA: –11.1%), 2002 (DJIA –12.4%), the collapse of Lehman Brothers in 2008 (DJIA: –6.0%), U.S. debt ceiling debacle in 2011 (DJIA –6.0%) and during the post-covid bear market in 2022 (DJIA –8.8%).
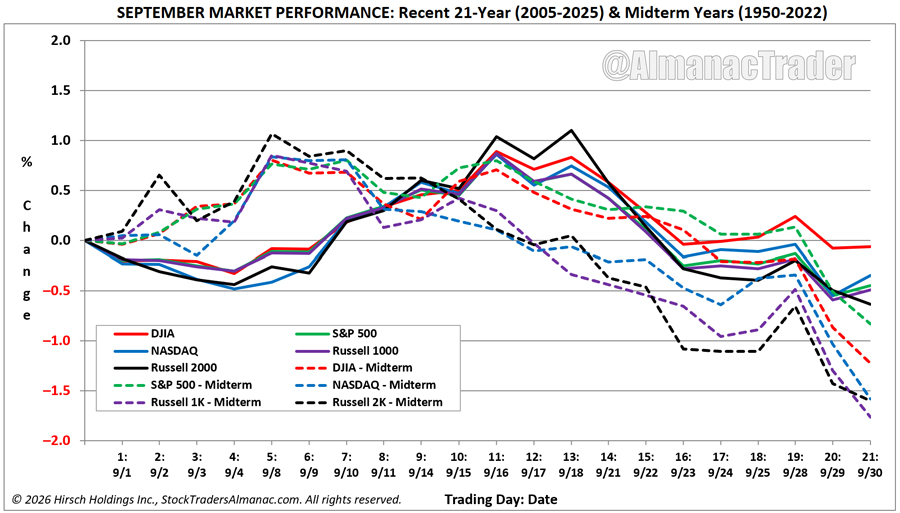
The recent 21-year seasonal pattern for September shows a relatively fair start to September, with most indexes rallying through the first half of the month following a brief bout of weakness during the first four trading days, reaching a peak around mid-September (trading days 11 to 13). From there, performance typically deteriorates, particularly during the final two weeks.
Midterm years show a similar early-month advance beginning at the start of September and peaking sooner, but the subsequent decline is sharper. By the final trading days, midterm-year losses accelerate across all major indexes, with Russell 1000, 2000, and NASDAQ among the weakest.
September Triple Witching week has been generally bullish with S&P 500 advancing better than three times for every two declines since 1990. However, it has suffered some sizable losses, and weekly performance has deteriorated since 2019 with S&P 500 declining in five of the last seven. Triple-Witching Friday was essentially a sure bet for the bulls from 2004 to 2011 but has been a loser nine, eleven, or twelve of the last fourteen years, depending on index with S&P 500 weakest, down 12 of the last 14. The week after Triple Witching has been brutal, S&P 500 down 28 of the last 36, averaging a loss of –0.99%. In 2022, DJIA, S&P 500, and NASDAQ all dropped 4% or more.
Labor Day has become the unofficial end of summer, and the three-day weekend is prime vacation time for many. Business activity ahead of the holiday was more enthusiastic in the old days. From 1950 through 1977 the three days before Labor Day pushed the DJIA higher in 23 of 28 years. Bullishness has since shifted to favor the Wednesday after the holiday as opposed to the days before. DJIA has advanced on 22 of the last 31 Wednesdays following Labor Day. Tuesday after Labor Day also leaned bullish, but DJIA has declined 13 of the last 16 (down the last 9 straight).
Jeff will be joining 75+ market experts over three days to help you prepare for what's ahead. We'll cover the forces shaping the markets — AI-driven innovation, interest rates, inflation, credit conditions, geopolitics, fiscal policy, energy, currencies, commodities, cryptocurrencies, and more — and show you how to put those insights to work in your own portfolio.
You won't just sit in a ballroom. You'll ask questions throughout the conference, meet speakers directly, swap ideas with fellow investors and traders, network at evening receptions, browse the Exhibit Hall, and watch live podcast sessions, social media interviews, and TV broadcasts.
Jeff would love to meet you in person, answer your questions, and share the strategies he is using heading into 2027.
Click here to reserve your pass and join Jeff — and dozens of his fellow market experts — in Orlando this October. Or call the MoneyShow team at 1-800-970-4355 and tell them Jeff sent you.
Hope to see you there.
|
September 2026 Strategy Calendar
|
|
By:
Christopher Mistal
|
August 20, 2026
|
|
|
|
|
Mid-Month Update: August New All-Time Highs—Breakout or Fake Out?
|
|
By:
Christopher Mistal
|
August 13, 2026
|
|
|
|
The market has displayed considerable resilience in August, bucking typical seasonal weakness, despite the continuing Iran war and the lack of any meaningful deal that restores normal shipping through the Strait of Hormuz. After closing at a new all-time high (ATH) twice last week, S&P 500 experienced modest pullbacks earlier this week before rebounding today, August 13, to close at another new ATH. S&P 500 rose 0.65% today, and is now up 4.13% this August, well above its historical full-month average of just 0.04% since 1950.
The market’s ability to advance reflects several supportive forces. Traders and investors have welcomed this week’s relatively subdued inflation data, which has reduced immediate pressure on the Federal Reserve to raise interest rates. July consumer prices (CPI) increased 0.1% month-over-month and 3.4% from a year earlier, while core CPI rose 0.2% monthly and 2.5% annually. Today’s Producer Price Index (PPI) was unchanged on a monthly basis suggesting some additional relief, with wholesale inflation slowing as energy, food, and transportation and warehousing costs declining in July.
However, the favorable inflation readings should not be interpreted as a definitive all-clear signal. Much of the current market optimism is backward-looking, while the economic consequences of the Iran war remain forward-looking. Energy prices fell today, with crude oil declining over 2%, but oil has remained highly volatile as the security of shipments through the Strait of Hormuz still remain in question. Any new disruption could quickly lift gasoline, transportation, manufacturing, and/or logistics costs, potentially reversing some or even all of the recent inflation improvement. This would likely put pressure back on the Fed to hike interest rates.
With valuations elevated and oil markets vulnerable to fresh headlines, market gains may remain fragile. A sustained rally will likely depend on continued evidence that inflation is cooling, energy flows are stabilizing, and the Iran war does not broaden out. Until those conditions become less hazy, the possibility of market volatility returning cannot be ruled out and it may be best to treat S&P 500’s record levels with some degree of caution.
S&P 500 August All-Time Highs — Bullish but Bumpy Signal
An S&P 500 new all-time high during August may seem surprising given the month’s reputation for marking the beginning of the market’s seasonally weak stretch. Yet history suggests that when S&P 500 is strong enough to reach new highs in August, the longer-term outlook tends to improve, even if traders and investors may want to consider being prepared for the return of volatility that often accompanies late summer and early fall in midterm years.
Since 1950, the S&P 500 has recorded one or more new all-time highs (ATH) during August in just 21 years (2026 excluded from the statistics). These years generally arrived after an already impressive first seven months of the year, with S&P 500 up an average of 12.31% through July, more than double the 5.68% average gain for all years since 1950.
Interestingly, August itself has also been stronger following an August breakout. The S&P 500 advanced an average of 1.16% and finished higher 66.7% of the time after making a new ATH in August, compared to an average gain of just 0.04% and a 55.3% win rate across all years. In other words, markets making fresh highs in August have typically been able to build on that momentum rather than immediately reverse.
September, however, remains the weak link. Even after an August ATH, September has averaged a 0.74% decline, although that is only slightly worse than the 0.63% average decline for all years. This suggests that the calendar’s most challenging month retains its reputation regardless of whether the market is coming off record highs or not.
Another notable difference appears over the remainder of the year. After an August ATH, S&P 500 has historically gained 3.01% during the fourth quarter, only modestly below the 4.21% average for all years. But because these strong years have already banked significant gains earlier in the year, the market still finishes August through December up an average of 3.33%, virtually identical to the 3.28% average for all years.
Where the August breakout years truly stand apart is in their annual performance. Full-year gains have averaged an impressive 15.80%, compared to 9.57% across all years since 1950. Even more impressive, the S&P 500 finished the year higher 95.2% of the time after making a new ATH in August versus 73.7% for all years. The only down year was 2018, also a Trump midterm year and a year where the Fed was struggling to find a proper level for interest rates.
That does not mean the ride is smooth. The average maximum drawdown occurring sometime during August through December has been 8.50%, very similar to the 9.49% experienced during all years. History shows that even in strong bull markets, investors may not want to forget that meaningful pullbacks can occur before the end of the year. On average, following new S&P 500 ATH in August, the drawdown tended to begin around mid-September and end in late October.
With the S&P 500 posting multiple new all-time highs in August 2026, history suggests the broader bullish trend remains intact. However, the data also serves as a reminder that record highs do not eliminate seasonal volatility or headline risk fueled by geopolitical events. Strong years have historically stayed strong, but they have rarely done so in a straight line. Watch for DJIA and NASDAQ to back up S&P 500 with new ATHs. The longer it takes for this to transpire, the greater the risk that the market’s August breakout could turn into a fake out that results in a typical seasonal retreat sometime during the remainder of August through early Q4.
|
Stock Portfolio Updates: NASDAQ’s Surge Ends, Headwinds Remain
|
|
By:
Christopher Mistal
|
August 06, 2026
|
|
|
|
NASDAQ’s impressive run of four consecutive daily gains of more than 1% came to an end an end on August 5. While the streak is over, its significance remains. Since the NASDAQ's inception in 1971, this is only the 18th occurrence of four straight 1%+ daily advances, underscoring just how uncommon this type of sustained buying pressure has been.
History has generally rewarded these powerful momentum bursts. Across the previous 17 occurrences, the four-day rally averaged an 8.33% gain before ending. Following the streak, NASDAQ was higher one month later 70.6% of the time with an average gain of 3.78%. Three months later, the index gained an average of 9.48% and advanced in 82.4% of cases. Six- and twelve-month returns were even stronger, averaging 19.03% and 26.61%, respectively.
However, a closer look at the data reveals an important distinction. The first seven occurrences (1974–1991) were overwhelmingly bullish. Aside from one modest one-year loss following the January 1987 streak and a slight six-month decline after the December 1991 signal, every instance produced positive intermediate- and longer-term returns, reflecting the powerful secular bull market environment of that era.
The 10 occurrences since 1988 tell a more mixed story. While the average four-day advance actually increased to 8.67%, subsequent gains have been more muted. One-month returns averaged just 1.73%, three-month gains averaged 6.34%, six-month returns 12.60%, and one-year gains 21.91%. The percentage of positive outcomes also slipped to 50% after one month and 70% over three months through one year, as several signals occurred during challenging bear markets in 1998, 2001, 2011, and 2022.
The takeaway is that this relatively rare momentum signal continues to lean bullish, but today's market has been less forgiving than the earlier decades. Strong buying thrusts still tend to favor higher prices over the intermediate to longer term, but since 1988 the path to those gains has tended to be more volatile. NASDAQ’s 4-day surge higher to start August was impressive but it may not be enough to overcome typical midterm year weakness in August and September, especially if the Strait of Hormuz deal does not materialize and energy prices begin to rise again.
Stock Portfolio Updates
Over the past four weeks, through the close on August 5, the Almanac Investor Stock Portfolio slipped 0.1% lower, excluding dividends and any potential interest generated by the cash position, compared to a 3.2% gain by S&P 500 and a 2.1% increase by Russell 2000 over the same time. Small-cap positions were best, up 5.3% on average while Mid- and Large-cap positions retreated 1.4% and 0.9% respectively. Defensive positions in the Large-cap portfolio were performing reasonably well until the market surged higher at the start of August on news of another potential deal to reopen the Strait of Hormuz to shipping traffic. The rush back to “risk on” positions, did result in defensive positions retreating.
As of the close on August 5, the
Dividend Stock basket from June 11, 2026, was up an average of 6.1%. The top performing position,
Perrigo (PRGO), in the Small-cap section of the portfolio was up 24.6%. PRGO reported earnings that beat estimates yesterday, sending shares higher by over 20%. It did give a part of the gain back today, but it looks likely that analysts will be adjusting their outlooks for PRGO now that it has beaten them in three of the last four quarters.
PRGO is on Hold.
Kenvue (KVUE) entered today’s earnings report with improving momentum and reported that first-quarter diluted EPS rose to $0.25 from $0.17 year-over-year. Despite the improvement, earnings did fall short of estimates. The near-term outlook remains mixed, with consumer-health demand, tariffs, litigation, and execution risks weighing on organic growth. However, the pending Kimberly-Clark acquisition, valued at approximately $21.01 per share in cash and stock, could provide some support if completed in the second half of 2026. KVUE is on Hold.
Kraft Heinz (KHC) reported first-quarter 2026 adjusted EPS of $0.58, exceeding expectations, but organic net sales remained under pressure amid cautious consumer spending and competitive pricing. Management reaffirmed its full-year outlook, projecting organic sales declines of 1.5%–3.5% and continued profitability pressure. This cautious outlook is likely sufficient to keep the bar low for next quarter’s earnings. KHC is on Hold.
It has been nearly two months and Energizer Holdings (ENR) and Newell Brands (NWL) have not traded below their respective buy limits. Rather than give chase, we are cancelling trades in ENR and NWL.
Other dividend yielding positions from June 11, CPB, SJM, MKC, HRL, MO, and PEP are also on Hold. Should the broader market’s latest push higher lose steam, these positions could quickly return to favor as traders and investors look for some defensive, dividend paying positions.
StoneX Group (SNEX) completed its 3-2 split and began trading on a split-adjusted basis on July 20. As a result of the split, its Presented Price and Stop Loss price have been adjusted. SNEX took a hit today, but it appears to be profit taking as it reported quarterly earnings that easily surpassed estimates. SNEX is on Hold.
Utility sector stocks, AEP, D, DUK, ETR, EXC, NEE, and SO remain a mixed bag and are collectively weaker since last update. Excluding dividends, these utility stocks were down 2.6% on average as of August 5. ETR and D are the only two positive, up 1.7% and 9.1% respectively. Higher interest rates and inflation are headwinds to these utility stocks. Longer-term their outlooks do improve as demand for electricity continues to grow.
On July 29, Emcor Group (EME) closed below its stop loss price of $690.24. Per standard trading guidelines (located at the bottom of the portfolio table below), EME was closed out of the portfolio the following trading session at its average price of $790.19. After selling half the original position when EME first doubled, the total gain on EME was a solid 187.1%.
All other positions not previously mentioned in the portfolio are on Hold. Please note some stop losses have been updated to account for recent moves.
Disclosure note: Officers of Hirsch Holdings Inc. held positions in AROC, HWAIF, SMCI, and SNEX in personal accounts.
|
ETF Trades: More Biotech & Info Tech on Dips
|
|
By:
Christopher Mistal
|
July 30, 2026
|
|
|
|
If you missed the member’s only webinar on Wednesday, the slides and video recording are available
here (or copy and paste in a new browser window: https://www.stocktradersalmanac.com/LandingPages/webinar-archive.aspx).
In the webinar we reviewed key seasonal pattern charts that we have been tracking throughout the year, the Iran war stalemate, how Q3 weakness sets up the 4-year cycle “Sweet Spot,” how the midterm year seasonal pattern could be overtaking the Trump year pattern, key technical support levels to watch for DJIA, S&P 500, and NASDAQ, a quick rundown of select commodity technicals and seasonals, along with Fed hesitation blues.
Despite today’s rebound rally driven by Microsoft and semiconductors, market headwinds are increasing. August and September are the worst two months of the year for the stock market. The Iran war appears to be worsening as Iran and its proxies continue to expand the scope of their attacks in what appears to be an effort to drive energy prices higher yet.
Inflation also remains well above the Fed’s stated 2% target. Today’s personal consumption expenditures price index (PCE) was down 0.1% from the prior month but year-over-year was still up 3.7%. Although today’s PCE was the first monthly decline in years, it is not expected to continue since energy prices have risen over the last month.
Also concerning was today’s advance estimate for Q2 gross domestic product (GDP), which came in at just 1.5%. While this figure is subject to revision, it was below expectations and points to a slowdown in economic activity from Q1’s pace of 2.1%. Historically, the combination of slow growth and elevated inflation has not been favorable for the stock market.
The risk of a seasonal pullback or retreat in the August to October timeframe appears to be increasing. For now, sitting tight and waiting for a better entry point is likely still the best course of action. The key index levels highlighted in the
August Outlook and yesterday’s webinar remain in play.
New Trade Ideas Based Upon August Sector Seasonalities
Two new bullish sector trades begin in August, but we are going to take a measured approach and not rush. The new trade ideas are suggested on dips with buy limits that are below current prices. If the new positions do not dip below their respective buy limits, that is fine as we can consider them again when the “Worst Months” end.
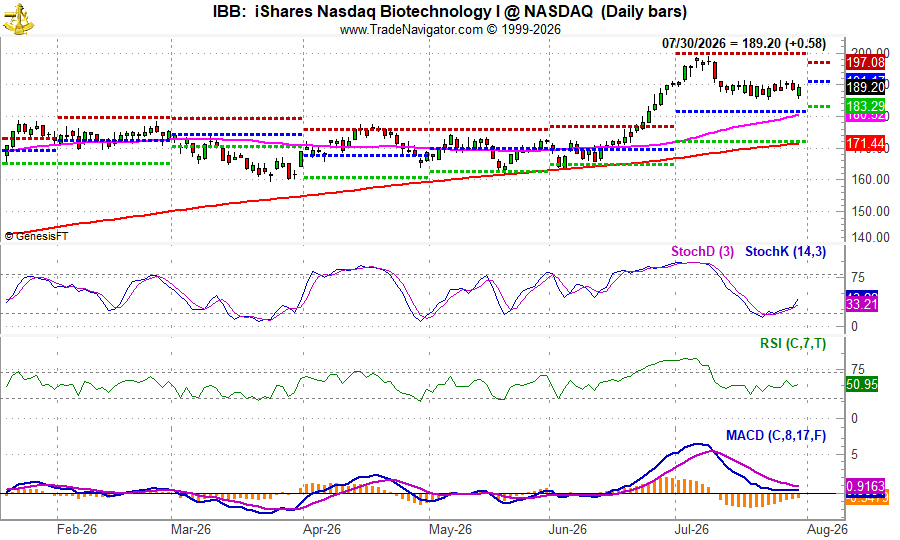
The biotechnology sector enters its historical favorable season in August. iShares Biotech (IBB) can be considered on dips below its buy limit of $182.45. A stop at $161.01 is suggested. The auto-sell price is $243.42 based upon historical average performance plus an additional 20%. An 11.18% average gain has occurred over the last 25 years while an average gain of 3.83% has occurred in the most recent 5 years (page 94 STA 2026) from the beginning of August through the beginning of March. Top five holdings are: Amgen, Vertex Pharmaceuticals, Gilead Sciences, Regeneron Pharmaceuticals, and argenx SE.
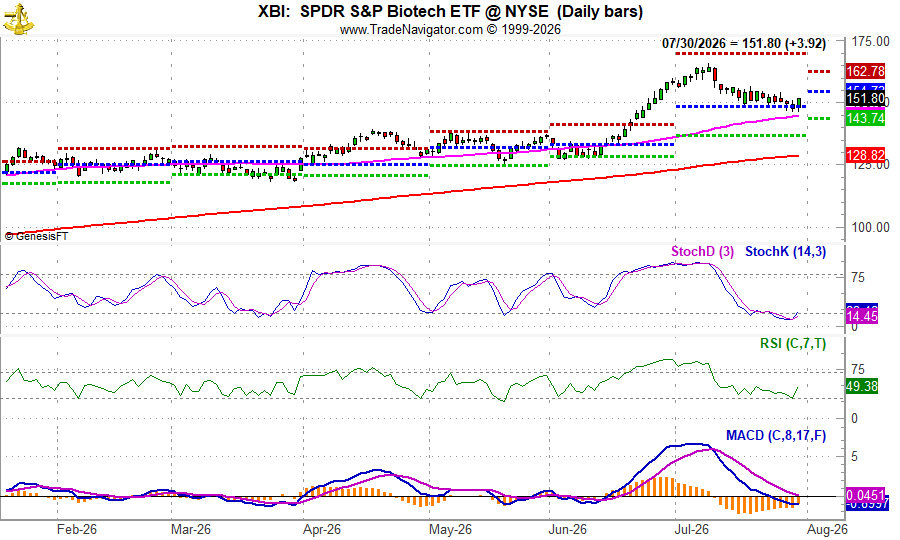
A second choice to consider for biotechnology seasonal strength is SPDR S&P Biotech (XBI). Unlike IBB, XBI tends to hold more speculative stocks with smaller market caps and its holdings are not as concentrated. XBI could be considered on dips below $142.25. If purchased, consider setting an initial stop loss at $125.54 and an auto-sell at $189.78. Top five holdings are: Apogee Therapeutics, Oruka Therapeutics, Dianthus Therapeutics, Kymera Therapeutics and Erasca.
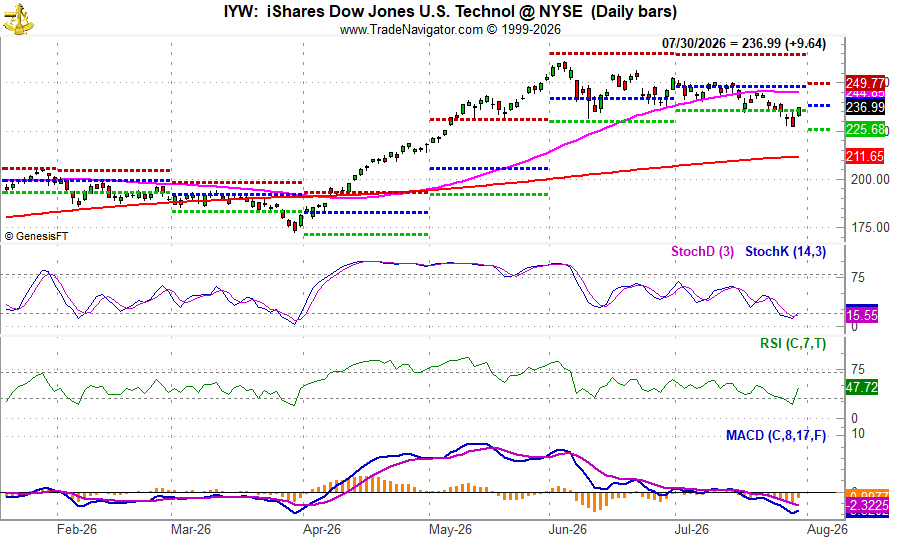
Over the last 25 years, Info-Tech has generated an average return of 9.67%, and for the last five years the average has been a solid 11.73% during its bullish season from mid-August to mid-January. Our top ETF within this sector is iShares US Technology (IYW). Set a buy limit at $208.50 and an initial stop loss of $184.00 if purchased. Should high-tech produce above average gains, profits can be taken at the auto-sell price of $274.39. IYW’s top five holdings are: Apple, Nvidia, Google (both share classes combined), Microsoft, and Broadcom. These five holdings represent a whopping 53.75% of IYW’s total holdings.
August’s final seasonality is a short trade in the Semiconductor sector. We are officially going to pass on this setup. Semiconductors have been trending lower since mid-June, but the day-to-day volatility makes shorting even more challenging. If you are comfortable with daily swings in excess of 5%, then perhaps shorting semiconductors is for you. If you are not, it is probably best to stay away until a new long trade opportunity clearly sets up, most likely sometime in or around October.
Sector Rotation ETF Portfolio Updates
Oil’s bearish seasonality comes to an end in August. We officially passed on trading this setup due to the ongoing Iran war. There is no corresponding position in the portfolio.
“Worst Months” defensive position in SPDR Consumer Staples (XLP), SPDR Healthcare (XLV), iShares Biotechnology (IBB), and SPDR Biotechnology (XBI) are on Hold. As of the close on July 29, all four positions were up on average 11.0%. Even after giving back some of their gains today, they are still outperforming the 3.2% gain by S&P 500 (as of July 30 close) since April 30.
SPDR Utilities (XLU) is on Hold. Excluding dividends and any trading fees XLU was down 3.9% yesterday. XLU has been held back by higher Treasury bond yields and cooling of the AI trade. Lower interest rates and a renewed interest in AI stocks could provide the utilities sector with the boost it needs. Longer-term, data center energy demand is likely to continue to grow.
Foreign ETFs, IDV, EFAV, and EFV are on Hold. Collectively, their average performance is a respectable 21.5% excluding dividends and any trading fees. Despite providing foreign market exposure, we suspect these ETFs could also present a better opportunity for additional purchases later this year, most likely in the September to October timeframe.
Trades in gold and silver related ETFs, GLD, SLV, GDX, and GDXJ have all been added to the portfolio. We were a little early to add them as the sector continued to soften through the first half of July. However, they have been showing some signs of strength and did jump today. GLD, SLV, GDX, and GDXJ can all still be considered at current levels or on dips below their respective buy limits.
Tactical Seasonal Switching Strategy Portfolio Update
In accordance with the July 17,
NASDAQ Seasonal MACD sell email Issue, QQQ and IWM have been closed out of the portfolio for gains of 15.5% and 19.8% respectively. As of today’s close, QQQ and IWM are still lower than when they were closed out.
Defensive positions in bond ETFs, TLT, AGG, BND, SHV and SGOV, are still flat to modestly negative excluding dividends and trading fees. TLT, AGG and BND are on Hold. The performance of TLT, AGG and BND will likely depend greatly upon the Fed and how it handles inflation. Our preferred bond ETFs are SHV and SGOV as both exhibit relatively stable pricing and have yields exceeding 3.5%.
Disclosure note: Officers of Hirsch Holdings Inc hold positions in EFAV, EFV, GLD, IBB, IDV, XBI, XLP, XLU and XLV in personal accounts.