|
November 2015 Trading & Investment Strategy
|
|
By:
|
October 29, 2015
|
|
|
|
|
Market at a Glance - 10/29/2015
|
|
By:
Christopher Mistal
|
October 29, 2015
|
|
|
|
10/28/2015: Dow 17779.52 | S&P 2090.35 | NASDAQ 5095.69 | Russell 2K 1178.72 | NYSE 10538.20 | Value Line Arith 4545.57
Psychological: Skeptical. Despite the market’s strong October performance,
Investors Intelligence Advisors Sentiment survey is showing bulls at 43.7%, bears at 29.2% and correction at 27.1%. This is essentially a neutral reading. Since late September bulls have been climbing slowly while bears and correction have been falling slowing. A slow reversal from the high levels of bearishness at the end of September suggests there is still plenty of cash on the sidelines and the market still has room to run higher.
Fundamental: Mixed. Corporate earnings continue to feel the pressure of lower commodity prices and a stronger U.S. dollar. There have been some notable misses, like Walmart (WMT) and IBM (IBM) and some notable homeruns like Amazon (AMZN), Alphabet (GOOG) and Microsoft (MSFT). Tepid growth, Q3 GDP of 1.5% in the third quarter, only further broadens the divide between hits and misses as the “rising tide” is not rising that quickly leaving the less nimble behind.
Technical: Improving. DJIA, S&P 500 and NASDAQ have all successfully completed a “W” or 1-2-3 bottom chart pattern. DJIA has fully recovered from its mini waterfall decline in August while S&P 500 and NASDAQ are on the cusp of doing the same. Once rapidly declining 50-day moving averages are now beginning to flatten and turn the corner towards higher. This all improves our comfort level with our bullish outlook for the rest of 2015 and Q1 2016. In the near-term, the markets rapid rise this month has stretched Stochastic, relative strength and MACD indicators to the verge of overbought levels increasing the odds of a brief period of consolidation or weakness.
Monetary: 0-0.25%. Another Fed meeting, another kick-of-the-rate-increase-can. Perhaps the best argument for raising interest rates now (or even in the foreseeable future) is the current range was an emergency measure and the emergency is over. Year-over-year, seasonally adjusted CPI has been between 0.2% and –0.2% since January 2015. This is well below the Fed’s 2% target. Sure the headline unemployment rate has a “5” handle, but the labor force is currently the same size it was back in the 70’s, so just how robust is the labor market. Although the Fed is leaning toward tightening at some point, current policy is highly accommodative to the economy and the stock market.
Seasonal: Bullish. November is the first month of the “Best Six Months” for DJIA and S&P 500 and NASDAQ’s “Best Eight Months.” DJIA and S&P 500 have average gains of 1.5% since 1950 in November and NASDAQ has averaged 1.6% since 1971. However, in pre-election years, November’s performance is substantially weaker. DJIA has advanced in only half of the last 16 pre-election years since 1950 with an average gain of 0.3%. S&P 500 has been up in 9 of the past 16 pre-election years, also gaining on average a paltry 0.3%. Small-caps and techs perform better with Russell 2000 climbing in 5 of the past 9 pre-election years, averaging 1.0%.
|
November Outlook: Sit Tight, Buy Dips, Ride the Yearend Rally
|
|
By:
Jeffrey A. Hirsch & Christopher Mistal
|
October 29, 2015
|
|
|
|
[
Editor’s note: Early next week we expect to ship 2016 Stock Trader’s Almanacs
to all active subscribers. To ensure we ship your FREE bonus copy to the proper address, please take a moment to login to your account at www.stocktradersalmanac.com and verify and/or update your address information. Your address can be found after logging by clicking on “My Account” at the top right of the page. Also, click on “Subscriptions” and verify that you will be active through at least October 31, 2015. If your subscription expires in the next few days, you will miss out on the free bonus Almanac
. If you have any troubles accessing your account, password reset is available here: https://www.stocktradersalmanac.com/RetrievePassword.aspx.]
Earlier this week Jeff ventured down to Charleston, South Carolina for a little keynote presentation to our friends at
Ausdal Financial Partners. Every year they hold their annual meeting, which they call Rumpus, somewhere fun for their advisors to go over the latest compliance requirements, attend product and information presentations, exchange notes and have little fun.
Jeff is pleased to report that Rumpus 15 in Charleston was a brilliant event, featuring classic Low Country fair and a fantastic opportunity to meet and mingle with a class organization and some of the sharpest independent advisors out there. Rob Ausdal, AFP President and CEO, and Jeff are both members of the
Probabilities Fund Management LLC investment committee.
AFP’s Rumpus was the perfect occasion for Jeff (and Rob) to further impart to advisors the benefits of using our brand of historical, seasonal, trend and cycle research in conjunction with fundamentals, technicals and macroeconomic analysis – and how they are implemented with Probabilities Fund Management investment products.
In addition to the AFP Rumpus, Jeff was able to meet with an independent advisor team, not affiliated with AFP, from
RS Wealth Management out of Wrightsville Beach, North Caroling who uses the Almanac and Probabilities products already. These two gentlemen trekked down to Charleston and provided much insightful feedback and Jeff was able to clarify and shed light several market pattern nuances.
Late-Day Smart-Money Rally Bodes Well For Stocks
The market spent most of the day in the red until it rallied in typical fashion in the last hour to move into positive territory before closing fractionally in the red, down less than a point on the S&P 500. One of the most consistent market patterns we track in the Almanac and use when exiting or entering positions is the intraday market patterns.
Despite the prevalence of high-frequency, program and algorithmic trading, the market’s intraday pattern, which is driven by the collective behavior and daily routines of all the individual participants, continues to persist. As illustrated in the chart below from page 139 of the 2016 Almanac, you can see the so called “dumb” money which often comes in scared in the morning and selling, then a rally until the lunchbreak pause, a post-lunch rally, the afternoon coffee run selling and then a rally to the close with “smart” money buying.
This late-date rally today, while not resulting in a positive day, is emblematic of the market’s underlying strength. However, after expected turn-of-the-month bullishness as illustrated on our
November and
October Strategy Calendars, a minor pullback after the
banner October gains this year is too be expected.
Pulse of the Market
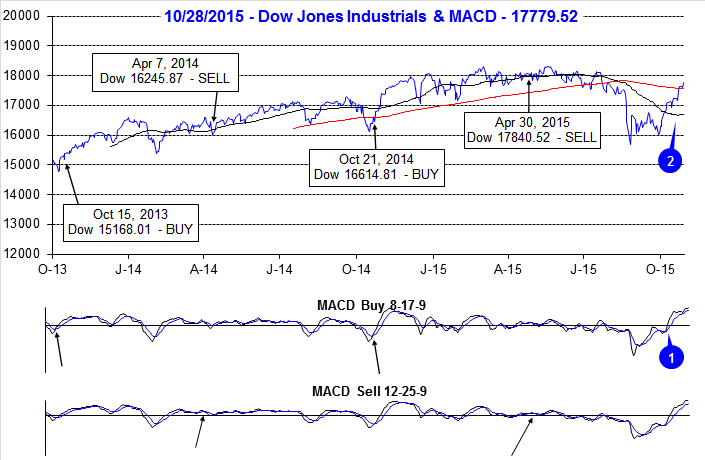
Through yesterday’s close, DJIA has gained 6%, S&P 500 has added 5.2% and NASDAQ was up 6.6% since we issued our
Seasonal MACD Buy Signal when the market closed on October 5 (1). Barring any significant decline tomorrow, October 2015 will go on the record as DJIA’s biggest monthly point gain ever and will be just the third time in history it has gained more than 1000 points in a single month. The previous two occasions were October 2011 and April 1999.
When the month began, DJIA was trading below its 50- and 200-day moving averages (2). As of yesterday, DJIA has reclaimed both of these key levels (2), successfully completed the “W” or “1-2-3” bottom pattern we were tracking and is trading above the level it was at before the mini waterfall decline of August. All of this gives us greater comfort in our currently bullish outlook for the rest of 2015 and Q1 2016.
Further confirmation of October’s strength and the apparent improvement in investor/trader confidence can be seen in the Pulse below. DJIA, S&P 500 (4) and NASDAQ (5) have all logged weekly gains for four weeks straight and these gains were accompanied by strength on Fridays and Mondays with only this past Monday suffering a modest DJIA decline (3). We have repeatedly noted the importance of Friday and Monday trading and the past four weeks are a perfect example. It is bullish when traders and investors are buying on Friday, holding over the weekend and then buying again on Monday.
Looking back through nearly 15 years of Pulse history, the last time a four week span had just a single red blemish in it, like the last four weeks, was in March of 2010 when DJIA, S&P 500 and NASDAQ all advanced for five straight weeks.
NYSE Weekly Advance, Decline, High and Low metrics have all improved substantially during the current rally. NYSE Weekly Advancers have outnumbered Decliners for three straight weeks (6). Weekly New Highs (7) have been expanding for three straight weeks as well. New Lows fell abruptly the second week of October and have crept higher, but remain subdued. The number of New Highs and Lows are currently at neutral levels leaving room for the market to continue its climb.
Weekly CBOE Put/Call Ratio (8) has remained stubbornly elevated throughout October. For some this could be a worrisome sign, but it is more likely a healthy amount of skepticism. As long as the ratio hangs out around its current reading, the rally is most likely to remain intact.
Click for larger graphic…
|
November 2015 Strategy Calendar
|
|
By:
Christopher Mistal
|
October 27, 2015
|
|
|
|
|
November Almanac, Vital Stats & Strategy Calendar:
|
|
By:
By Jeffrey A. Hirsch & Christopher Mistal
|
October 27, 2015
|
|
|
|
[Editor’s note: Early next week we expect to ship 2016 Stock Trader’s Almanacs
to all active subscribers. To ensure we ship your FREE bonus copy to the proper address, please take a moment to login to your account at www.stocktradersalmanac.com and verify and/or update your address information. Your address can be found after logging by clicking on “My Account” at the top right of the page. Also, click on “Subscriptions” and verify that you will be active through at least October 31, 2015. If you subscription expires in the next four days, you will miss out on the free bonus Almanac
. If you have any troubles accessing your account, password reset is available here: https://www.stocktradersalmanac.com/RetrievePassword.aspx.]
November maintains its status among the top performing months as fourth-quarter cash inflows from institutions drive November to lead the best consecutive three-month span November-January. The month has taken hits during bear markets and November 2000, down –22.9% (undecided election and a nascent bear), was NASDAQ’s second worst month on record—only October 1987 was worse.
November begins the “Best Six Months” for the DJIA and S&P 500, and the “Best Eight Months” for NASDAQ. Small caps come into favor during November, but don’t really take off until the last two weeks of the year. November is the number-three DJIA and number-two S&P 500 month since 1950. Since 1971, November ranks third for NASDAQ. November is now the number one month for Russell 1000 and second best for Russell 2000 since 1979.
In pre-election years, November’s performance is substantially weaker. DJIA has advanced in only half of the last 16 pre-election years since 1950 with an average gain of 0.3%. S&P 500 has been up in 9 of the past 16 pre-election years, also gaining on average a paltry 0.3%. Small-caps and techs perform better with Russell 2000 climbing in 5 of the past 9 pre-election years, averaging 1.0%. NASDAQ has been up in 6 of the last 11 pre-election year Novembers with an average 0.9% gain. Contributing to pre-election year November’s weaker performance is nasty declines in 1987, 1991 and 2007
Options expiration often coincides with the week before Thanksgiving. DJIA posted ten straight gains 1993-2002 and has been up 17 of the last 22 weeks before Thanksgiving. The Monday of expiration week had been streaky with the DJIA up five straight, 1994-1998, during the bulk of the last 20th Century bull market, down five in a row, 1999-2003, up three, 2004-2006, but has been mixed since 2007, up four and down four. The net result is a bearish down 9 times in the last 16 years. Options expiration day has a clearly bullish bias, up 11 of the last 13. The week after expiration has been weak lately, down five of the last nine, but up 9.7% in 2008, enough to be the best November weekly DJIA performance since 1950.
Being a bullish month November has seven bullish S&P days, though it does have weak points. NASDAQ and Russell 2000 exhibit the greatest strength at the beginning and end of November. Russell 2000 is notably bearish on the 12th trading day of the month (November 17, 2015), when the small-cap benchmark has risen just five times in the last 31 years (since 1984). The Russell 2000’s average decline is 0.49% on the day. Recent weakness around Thanksgiving has shifted DJIA and S&P 500 strength to mirror that of NASDAQ and Russell 2000 with the majority of bullish days at the beginning and end of the month. The best way to trade Thanksgiving is to go long into weakness the week before the holiday and exit into strength just before or after.
| November (1950-2014) |
| |
DJI |
SP500 |
NASDAQ |
Russell
1K |
Russell 2K |
| Rank |
|
3 |
|
2 |
|
3 |
|
1 |
|
2 |
| #
Up |
|
43 |
|
43 |
|
29 |
|
26 |
|
23 |
| #
Down |
|
22 |
|
22 |
|
15 |
|
10 |
|
13 |
| Average
% |
|
1.5 |
|
1.5 |
|
1.6 |
|
1.7 |
|
1.8 |
| 4-Year Presidential Election Cycle Performance
by % |
| Post-Election |
|
1.8 |
|
1.7 |
|
2.4 |
|
3.7 |
|
2.8 |
| Mid-Term |
|
2.5 |
|
2.6 |
|
3.7 |
|
2.7 |
|
3.5 |
| Pre-Election |
|
0.3 |
|
0.3 |
|
0.9 |
|
-0.3 |
|
1.0 |
| Election |
|
1.5 |
|
1.3 |
|
-0.6 |
|
0.5 |
|
-0.2 |
| Best & Worst November by % |
| Best |
1962 |
10.1 |
1980 |
10.2 |
2001 |
14.2 |
1980 |
10.1 |
2002 |
8.8 |
| Worst |
1973 |
-14.0 |
1973 |
-11.4 |
2000 |
-22.9 |
2000 |
-9.3 |
2008 |
-12.0 |
| November Weeks by % |
| Best |
11/28/08 |
9.7 |
11/28/08 |
12.0 |
11/28/08 |
10.9 |
11/28/08 |
12.5 |
11/28/08 |
16.4 |
| Worst |
11/21/08 |
-5.3 |
12/21/08 |
-8.4 |
11/10/00 |
-12.2 |
11/21/08 |
-8.8 |
11/21/08 |
-11.0 |
| November Days by % |
| Best |
11/13/08 |
6.7 |
11/13/08 |
6.9 |
11/13/08 |
6.5 |
11/13/08 |
7.0 |
11/13/08 |
8.5 |
| Worst |
11/20/08 |
-5.6 |
11/20/08 |
-6.7 |
11/19/08 |
-6.5 |
11/20/08 |
-6.9 |
11/19/08 |
-7.9 |
| First Trading Day of Expiration Week: 1990-2014 |
| #Up-#Down |
|
13-12 |
|
11-14 |
|
11-14 |
|
12-13 |
|
13-12 |
| Streak |
|
U2 |
|
U3 |
|
D1 |
|
U3 |
|
D1 |
| Avg
% |
|
-0.03 |
|
-0.1 |
|
-0.1 |
|
-0.1 |
|
-0.03 |
| Options Expiration Day: 1990-2014 |
| #Up-#Down |
|
18-7 |
|
16-9 |
|
12-13 |
|
16-9 |
|
12-13 |
| Streak |
|
U5 |
|
U3 |
|
U3 |
|
U3 |
|
U5 |
| Avg
% |
|
0.3 |
|
0.2 |
|
-0.001 |
|
0.2 |
|
0.1 |
| Options Expiration Week: 1990-2014 |
| #Up-#Down |
|
18-7 |
|
16-9 |
|
14-11 |
|
15-10 |
|
13-12 |
| Streak |
|
U2 |
|
U2 |
|
U2 |
|
U2 |
|
D1 |
| Avg
% |
|
0.4 |
|
0.1 |
|
0.1 |
|
0.06 |
|
-0.2 |
| Week After Options Expiration: 1990-2014 |
| #Up-#Down |
|
13-12 |
|
14-11 |
|
16-9 |
|
14-11 |
|
15-10 |
| Streak |
|
U3 |
|
U3 |
|
U3 |
|
U3 |
|
U3 |
| Avg
% |
|
0.5 |
|
0.6 |
|
0.8 |
|
0.6 |
|
0.8 |
| November 2015 Bullish Days: Data 1994-2014 |
| |
4,
5, 12, 13, 16 |
3,
4, 5, 13 |
2-5,
12, 20 |
3,
4, 5, 12, 13 |
3, 4, 5, 11 |
| |
20,
23, 24, 25 |
24,
25, 27 |
23,
25, 27 |
16,
23, 24, 25, 26 |
23, 27 |
| November 2015 Bearish Days: Data 1994-2014 |
| |
None |
10,
30 |
None |
10 |
10, 17 |
| |
|
|
|
|
|
|
Portfolio Updates: Continuing to Buy Dips
|
|
By:
By Christopher Mistal
|
October 22, 2015
|
|
|
|
DJIA, S&P 500 and NASDAQ have bullishly traced out and completed the “W” or “1-2-3” swing bottom pattern we first started
looking for at the end of September. DJIA and S&P 500 have climbed above their respective mid-September highs by the widest margin. As of today’s close, NASDAQ has managed to close above its mid-September closing high on a couple of occasions, but has yet to exceed its intra-day September high.
![[DJIA Daily Bar Chart]](/UploadedImage/AIN_1115_20151022_DJIA.jpg)
![[S&P 500 Daily Bar Chart]](/UploadedImage/AIN_1115_20151022_SPX.jpg)
![[NASDAQ Daily Bar Chart]](/UploadedImage/AIN_1115_20151022_NAS.jpg)
However, one potential area of concern, which has been cited by other sources as well, is the laggard, nearly dismal performance of small-cap stocks recently. Small-cap performance, measured by the Russell 2000, has been lacking and it was lacking today as the index mustered only half the gains of either DJIA or S&P 500. At the moment, this laggard performance is not without precedent and not really as big of a deal as some may think. In fact, if you were to review page 110 of the Stock Trader’s Almanac 2015, you would find it is actually quite normal for small-caps to be lagging large-caps at this time of year. This laggard performance by small-caps typically starts in mid-September and lasts until late-November or mid-December when the “January Effect” usually begins to take hold. So even absent small-cap participation, large-caps can continue to rally.
Stock Portfolio Updates
Since last update on October 6, the Stock Portfolio has gained 0.8% while the S&P 500 and Russell 2000 have climbed 2.0% and 1.0%, respectively, as of yesterday’s close. This performance is respectable considering the sizable cash position that was held in the portfolio at the start of the month. Our Stock Portfolio produced gains across all three market cap ranges. Mid-cap stocks were best up 1% while small-caps and large-caps both advanced 0.7%.
Nine of the sixteen
new stock ideas presented on October 13 have been added to the portfolio. Most of the new additions were added last week. CCS, PLOW and LGIH were added to the small-cap portfolio. TMH was added to the mid-cap portfolio. CNC, DHI, HBI, NTRS and TSCO were added to the large-cap portfolio. As of yesterday’s close, PLOW and HBI were the weakest performing since being added, both off 2.2%.
Team Health (TMH), up 19.9% (before today’s beating) and LGI Homes, up 10.8% performed the best.
With the exception of LGIH, TMH and DHI, all other new trade ideas from the mid-October basket can be considered on dips below their buy limits or at current levels. See table below for current, stock-by-stock advice.
As a reminder, should Global Brass and Copper Holdings (BRSS) trade at or above $24.66, sell half of your original position. BRSS traded as high as $23.93 today and has been one of the top performers in the portfolio over the past few months, successfully bucking commodity and broad market weakness.
ETF Portfolio Updates
A mid-month market breather allowed the addition of three open ETF trade ideas. iShares NASDAQ Biotech (IBB) was added on October 7 when it traded below $300 per share. SPDR Financial (XLF) was added on the fourteenth at $22.90 and the short heating oil trade using PowerShares DB Energy (DBE) was executed when it broke down through support at $13.84.
With the exception of IYZ, XLB and DBE, the rest of the ETF Portfolio can still be considered on dips below their respective buy limits. A few of the buy limits, like the one applied to IYT, are currently well below current market prices. Be patient, we do not want to chase these positions. There is still ample uncertainty out there that could easily volatility.
Due to recent gains, numerous stop losses have been updated. See table below for latest advice.
Disclosure Note: At press time, officers of the Hirsch Organization, or accounts they control held positions in CNC, HBI, IBB, IWM, NTRS, PLOW, QQQ, TMH, TSCO, XLV and XRT.
|
Las Vegas Market Sentiment
|
|
By:
Jeffrey A. Hirsch
|
October 20, 2015
|
|
|
|
The MoneyShow’s Las Vegas Trader’s Expo was held a month earlier this year at Paris Hotel, which was a pleasant change from the usual venue at Caesars Palace. Admittedly, Caesars is a level above Paris in many respects, but I must tell you the schlep from the room to the convention site in Caesars is a mile or 2 away. Paris is a more intimate setting and the trip from your hotel room to the presentation ballroom is much more manageable and does not put you in a full lather.
The show has evolved over the years to be less exhibit hall and exhibitor centric and geared more toward speaker presentations and trader and investor education class oriented. My main event was a four-hour paid event Master Class Trading 301: Intensive In-Depth Training for Portfolio Construction Position & Risk Management. But more on that in a moment.
On Wednesday eve for the exhibit hall opening and welcome reception the hall was jammed and jumping – a good sign. This was also the case throughout the event, attendance was solid. My big day was Friday with an 8am educational presentation and the Trading 301 class from noon to 4pm. Though 8am is early in Vegas, folks showed up and I gave them a short and sweet rundown of current “Election Cycle & Best Six Months Trade Setups.”
I covered the woeful record of the 7th and 8th years of presidential terms (the 3rd and 4th years of 2-term presidents) and how that is tempering my bullish seasonal and technical outlook along with tepid fundamentals and economic readings and geopolitical concerns. Then we got into the Best Six Months record, recent buy signal and trade setups. I ripped through all our current sector ETF and stock trade ideas.
Between my sessions I set up shop for a couple hours at the Money Show Hub with some brand-new, hot-off-the-press Stock Trader’s Almanac 2016. Since there was no book store there this time, and I know many folks expect to pick up their annual copy there, I figured it would be a nice thing to make available. Subscriber copies are currently in route to our warehouse and I expect to begin shipping them soon.
What struck me at that moment was that while I was at The Hub that Friday morning, my friend Cindy Faber, instructor for
TD Ameritrade, was giving a trade demonstration to a seated group and also broadcasting online, and when she polled the group for bulls and bears not one bull put up their hand. I of course popped my head around the corner and put my bullish hand up, smiled and waved to Cindy and said I’m bullish.
Such a low number of bulls in the crowd is a rather contrary bullish sentiment reading. In fact there were not many bears either. No one in Cindy’s group put up a bearish hand either. This illustrates to me that investors are rather confused and lack conviction much like the AAII Investor Sentiment chart below with bulls and bears even at about 30%.
My long class was attended by a more seasoned crowd and we dug deep into our behind the scenes stock and ETF selection process (the DVD will be available shortly). I could tell this group knew what they were as they responded well to my call for them to participate and help me with the process. This group was equally cautiously bullish as I am and they took home a solid list of attractive undervalued stocks to trade.
I hope all readers have been cautiously getting long again since our buy signal, but remaining vigilant with stops. We are not as bullish as we were last year at this time and have relayed our concerns in previous posts and alerts. We’ll be looking for the major averages to get back above there August 18-19 levels, before the waterfall decline, in conjunction with stronger market internals before getting more bullish. And as I mentioned, next year promises to be difficult for the market.
|
Mid-Month Update: More Upside Anticipated, but It will be a Struggle
|
|
By:
Christopher Mistal
|
October 15, 2015
|
|
|
|
To recap, we issued our
Seasonal MACD Buy Signal after the close on October 5. On the following day new long positions in DIA, SPY, QQQ and IWM were established in the
Almanac Investor ETF Portfolio and remaining defensive positions were closed out. We also closed out short stock positions in the Stock Portfolio. On Tuesday of this week we put our proprietary stock selection process through its paces to unearth sixteen new long stock trade ideas. All of our recent long trade ideas can be considered on dips below their respective buy limits. Thus far, the market has been assisting us in establishing these new positions. It has taken a moment to digest its recent move and the prospects for the balance of the fourth quarter.
Current investor sentiment readings do appear to be setting up in support of a year-end rally. According to
Investors Intelligence latest Advisors Sentiment survey, the percent of bullish advisors has rebounded nicely to 36.5% after hitting a multi-year low of 24.7% at the end of September. Bearish and correction advisors are currently at 31.2% and 32.3%, respectively. This is a healthy amount of skepticism which leaves room for the market to work its way higher.
Sadly the current fundamental situation is not a positive, but many of the weak and/or tepid data is backwards looking. For starters, this week’s September Retail Sales figures were a disappointment coming in at a seasonally adjusted rate of just 0.1% when compared to August. Motor vehicle sales were the brightest part of the report and accounted for the gain. Apparently lower fuel prices are helping some, just not as much as many had expected. I suspect the market’s wild ride in September was the largest reason consumers held back, at least partially. Holding onto some additional cash after making a major purchase while the news is full of negative stock market headlines does seem rational.
Walmart (WMT) warning of lower earnings and revenue also does not help. But, let’s not overlook the main reason why earnings are expected to fall at the world’s largest retailer; they are going to give many of their employees a raise. Yes this will hurt profits in the near-term, but it is a good thing over the longer-term. Their employees are consumers too. Higher earnings will likely lead to higher spending and possibly happier employees. Walmart has a tremendous amount of competition here and abroad in the “affordable” product category. A cleaner, more customer friendly shopping experience should help Walmart reclaim must of the ground it has lost in recent years.
Recent inflation data is also something to be concerned about, although it is something of a double-edged sword as the lower it goes, the lower inflation expectations go and the less likely the Fed is to raise rates. The Fed meets again later this month and it would be absolutely shocking for them to make any move this month. Actually, it would be surprising if more than ten words are changed from September’s statement. Recent jobs market data has softened, notably average hourly earnings. This combined with the recent plunge in the Consumer and Producer Price Indices (CPI & PPI) suggest the Fed might actually have to take rates negative.
![[Inflation Chart]](/UploadedImage/AIN_1115_20151015_CPI_PPI.jpg)
To put recent inflation data into perspective, the six-month exponential moving average (EMA) of year-over-year CPI and PPI (not seasonally adjusted) from 1980 to present are plotted above. The solid black line represents the Fed’s “2% target.” Not-seasonally-adjusted data was selected for its purity. There is enough statistical magic in CPI and PPI that adjusting it is just overkill. The 6-month EMA smooths the spikes and valleys in the data series and produces a reliable trend.
As of the most recent September readings, PPI is not that far from its low reached in September 2009 while CPI is on the verge of going negative. It would seem the Fed has just a few options at this point; leave rates alone and wait, consider taking rates negative or possibly more QE. A final possibility could be to just undue several decades of tweaks designed to mask inflation. The Fed was aggressive in fighting deflation a few years ago, so it is only reasonably to assume they will do so this time around. Cheap money has fueled record dividends and share buybacks which has been bullish for stocks. A short-term stock market bump is the most probable outcome as long as the Fed does not raise rates.
Technically, there is still one divergence in the charts of DJIA, S&P 500 and NASDAQ that needs to be rectified before the rally can resume in earnest. DJIA and S&P 500 have traced out a “W” or “1-2-3” bottom pattern nicely and have reclaimed their respective 50-moving averages, and held them. Today’s NASDAQ gains have finally lifted it above its 50-day moving average (solid magenta line in next chart), but it now needs to climb above its mid-September closing high to successfully complete its bottom. A close above 4900 would do it, but then NASDAQ will need to contend with resistance at its 200-day moving average (solid red line in next chart), currently at 4918.
![[NASDAQ Daily Bar Chart]](/UploadedImage/AIN_1115_20151015_NASDAQ.jpg)
We are bullish again after spending much of the summer on the defense however, our current bullish stance is not a strong as it was last year at this time or at the start of previous “Best Six Months.” Economic data this time around is mixed at best and borderline gloomy at worst while typical pre-election-year forces have failed to prop the market up this year. Most economic data tends to be backward looking while the stock market tends to look forward. Earnings are expected to rebound next year and the Fed is most likely going to remain accommodative in the face of recent labor market and inflation data. We do expect the market to make a run back towards its recent record highs sometime during the “Best Six Months,” but we do not see a tremendous amount of upside potential after that.
|
Mid-October Stock Basket: Buying the dips
|
|
By:
Christopher Mistal
|
October 13, 2015
|
|
|
|
After putting up its best week of the year, the market is taking a pause to consolidate recent gains and evaluate earnings reports. For the week ending October 9, S&P 500 was up 3.3%, Russell 2000 gained 4.6% and DJIA was up 3.7% (second best of 2015). Technology was the laggard last week with NASDAQ advancing just 2.6% (seventh best week of 2015). Thus far, our Seasonal MACD Buy Signal issued after the close on October 5 has proved timely. We entered new long positions associated with our Best Six Months Switching Strategy during weakness last Tuesday and were rewarded with a fair portion of last week’s advance.
![[DJIA Daily Bar Chart]](/UploadedImage/AIN_1115_20151013_DJIA.jpg)
![[S&P 500 Daily Bar Chart]](/UploadedImage/AIN_1115_20151013_SPX.jpg)
![[NASDAQ Daily Bar Chart]](/UploadedImage/AIN_1115_20151013_NASDAQ.jpg)
DJIA and S&P 500 have broken through resistance at their rapidly descending 50-day moving averages (solid magenta line), but NASDAQ came up short during the recent rally. For this rally to resume we are looking for DJIA and S&P 500 to hold above their respective 50-day moving averages or at worst dip and/or close just slightly below and for NASDAQ to “catch up”. Without NASDAQ leading the rally, a robust fourth quarter performance will become even more challenging for the market.
A Basket of Stocks for the “Best Months”
These 16 stocks all have reasonably solid valuations, healthy revenue and earnings growth, while exhibiting positive price and volume action as well as other constructive technical and chart pattern indications. The group of 16 covers a broad array of sectors and industries. It also runs the gamut of market capitalization with a mix of large caps with more than $5 billion in market value, midcaps in the $1-5 billion range, and small caps under $1 billion with one microcap for good measure to round out the diversity.
We first sifted through the universe of about 8,000 U.S. traded stocks for those with a market cap of at least $25 million and average daily volume of 50,000 shares or more on average over the past twenty trading sessions. Then we winnowed the list down to only those stocks with relatively low price-to-sales and price-to-earnings ratios. From there we looked for stocks that were exhibiting revenue and earnings growth.
With this list of about 50 stocks we dug into each individual company and chart before settling on these final 16 stocks. Our underlying theme was to find reasonably priced stocks quietly growing sales and earnings that are flying somewhat under the radar with few on The Street paying close attention to them. As market cap goes higher, this becomes increasingly challenging and a history of earnings surprises becomes even more important.
At the end of the screening process we found that homebuilders, medical and financial industries were well represented in the basket. We did not search specifically for top-preforming stocks within these sectors, this just happens to be where reasonable value and solid growth currently exist.
This basket is being presented in order to take advantage of the “Best Six Months” (November to April) for stocks. Volatility is still present and we will look to add these 16 stocks, in the table below, on dips. We will allocate a hypothetical $2000 from the cash position in the portfolio to each position. For each stock we have provided the ticker, name, sector, general business description, plus annual sales growth, PE, price-to-sales ratio, market value, a dividend yield and a suggested buy limit and stop loss.
Click to view full size…
|
Seasonal Sector Trades: S&P 500 Halloween to Christmas Gains & Energy Short Setup
|
|
By:
By Christopher Mistal & Jeffrey A. Hirsch
|
October 08, 2015
|
|
|
|
“Massive S&P 500 Gains Halloween to Christmas” is the largest dollar amount winning trade last featured in the Commodity Trader’s Almanac 2013. It now has a cumulative profit of $289,338 per single futures contact over the last 33 years including most recent data. This trade is obviously linked to the beginning of the “Best Six Months” of the year as detailed in the Stock Trader’s Almanac 2015. Going long the S&P 500 near the end of October and holding until just before Christmas has been successful 25 of the last 33 years, or 75.8% of the time. The average move during this trade’s timeframe has been 4.2% since 1982. Seasonal strength is shaded in yellow in the second chart below.
![[October Long S&P 500 (December) Trade History Table]](/UploadedImage/AIN_1115_20151008_SP_History.jpg)
Choices to execute this trade are numerous: full futures contracts, the e-mini electronic futures or a handful of ETFs such as SPDR S&P 500 (SPY) or Vanguard S&P 500 (VOO). SPY has the longest track record, the most assets and is the most heavily traded ETF making it a top choice. VOO’s main attraction is a net expense ratio of just 0.05%. Having issued our Seasonal MACD Buy Signal on October 5, exposure to this trade already exists in the ETF Portfolio, however this shorter-term stands to reinforces the importance of using any October weakness to enter new long positions. There have been just two losses in the past twelve years. Not a perfect track record, but certainly a high probability trade setup.
Pre-Winter Prep Pressures Heating Oil
Somewhat counter intuitively heating oil prices usually make a seasonal high well ahead of the peak demand time of the year. Refiners, retailers and consumers are highly trained to stock up on heating oil months before the dead of winter when temperatures are coldest and the need for heat is the greatest. In line with its parent product crude oil, heating oil has a penchant for forming a seasonal high in mid-October.
This sets up an autumn short trade opportunity. For the past 35 years selling December heating oil short on or about October 14 and holding until around Thanksgiving has been profitable 62.9% of the time, posting gains in 22 of these years for a cumulative gain of $59,228 per contract. This trade runs contiguous to the crude oil short from September to December. This trade’s record over the last fourteen years has improved with just three losses. This is good for a 78.6% success rate since 2001.
![[October Short Heating Oil (December) Trade History Table]](/UploadedImage/AIN_1115_20151008_HO_History.jpg)
Outside of the futures market there are a limited number of ETFs and/or ETNs that provide exposure to heating oil. The obvious first choice would seem to be United States Diesel-Heating Oil Fund (UHN). However, assets and daily trading volume are quite thin at just $4.7million and a few thousand shares per day. The next choice is PowerShares DB Energy (DBE). It has nearly $130 million in assets and trades around 50,000 shares per day on average. This is better, not great, but should be good enough to execute a short trade with. DBE’s holdings currently consist of approximately 21.85% Brent crude, 24.07% heating oil, 19.77% light crude, 10.43% natural gas and 23.87% RBOB gasoline.
![[PowerShares DB Energy (DBE) Daily Bar Chart]](/UploadedImage/AIN_1115_20151008_DBE.jpg)
Moving in response to recent strength in crude oil, DBE has ticked modestly higher in the past few trading sessions. MACD, Stochastic and relative strength indicators are currently all positive, but DBE appear to be stalling at projected monthly resistance (red dashed line). DBE could be shorted on a failed breakout above $15.05 or on a breakdown below its 50-day moving average at $13.84. Look for an accompanying roll over of its technical indicators to confirm the loss of momentum and change in direction. This trade will be tracked in the Almanac Investor ETF Portfolio.
|
Portfolio Updates: Pulling Defense and Going on the Offensive
|
|
By:
Christopher Mistal
|
October 06, 2015
|
|
|
|
As promised, today’s Alert is a continuation of yesterday’s Seasonal MACD Buy Signal. It is being delivered a little later than usual as all updates were done using today’s prices. Although the market did take a breather today, it is still on course to trace out and complete a “1-2-3” or “W” bottom formation pattern. The market also afforded us an opportunity to close out defensive positions in the Stock and ETF portfolios and add new long exposure at better prices than available yesterday in many cases.
As has been the case more often than not over the past 65 years, the market did stumble during this year’s “Worst Four/Six Months.” From our April 30 Seasonal MACD Sell Signal for DJIA and S&P 500 through yesterday’s Seasonal MACD Buy Signal, DJIA was down 6.0% and S&P 500 was off 4.7%. NASDAQ’s Seasonal MACD Sell Signal was on June 4 and it was off 5.5%. The naysayers will still call this year a fluke, but DJIA’s and S&P 500’s high year-to-date was in May while NASDAQ managed to eke out a slightly higher high in July. We call this year a resounding success for “Sell in May” and our Seasonal Switching Strategy.
Looking ahead to the rest of the year, seasonal patterns are aligning for a potentially robust yearend rally. There has not been a down DJIA pre-election year since 1939. Historically, a down August followed by a down September has preceded sizable Q4 gains. The fourth quarter is also the most bullish quarter of the year (page 102 of 2015 STA). Market sentiment is no longer excessively bullish while fundamentals are mixed just enough to support a Q4 rally as expectations for an improving economy in 2016 likely begin to gain traction.
Market volatility, measured by CBOE VIX is still somewhat elevated suggesting a few more wild daily swings are more than just likely. Buy limits and stop losses in the Almanac Investor Stock and ETF Portfolios have been selected with the goal of using any volatility to our advantage while establishing new long positions on dips and avoiding the dreaded whip saw stop loss once purchased.
Stock Portfolio Updates
Per yesterday’s Alert, all remaining short trades where covered today. The most successful of these trades was Bluebird Bio (BLUE) with a gain of 36.8%. However Biotech’s and Healthcare’s recent weakness was felt on other parts of the portfolio. Repligen (RGEN) and Omnicell (OMCL) were both stopped out in late September.
Americo Inc (UHAL), another longer-term holding had a solid September trading above $400 on multiple occasions towards the end of the month. Per standard trading guidelines half the original position in UHAL was sold on September 23 when it traded above $395.62, double its original price.
With the closure of several long positions and all short positions there is a sizable cash balance in the Stock Portfolio now. We will look to put this cash to work in a basket of undervalued, relatively unknown stocks exhibiting the greatest potential for growth and gains on Thursday, October 8.
ETF Portfolio Updates
Per yesterday’s Alert, all defensive positions and the last remaining short trade were closed out of the portfolio today. Late September weakness allowed the addition of XRT, IYZ, XLV and XLB, but also resulted in iPath Bloomberg Livestock Sub-TR ETN (COW) and iShares NASDAQ Biotech (IBB) being stopped out. COW we will pass on for now however, IBB can be bought on dips below $300.00.
SPDR DJIA (DIA), SPDR S&P 500 (SPY), PowerShares QQQ (QQQ), and iShares Russell 2000 (IWM) also appear in the table below and can be purchased at current levels or below their respective buy limits, whichever is lower. All other positions can also be considered at current levels or below their respective buy limits. See table below for updated buy limits, stop losses and auto-sell prices.
Disclosure Note: At press time, officers of the Hirsch Organization, or accounts they control held positions in IBB, IWM, QQQ, XLV and XRT.
|
Seasonal MACD Buy Signal Update: “Best Six/Eight Months” Commence Early
|
|
By:
By Jeffrey A. Hirsch & Christopher Mistal
|
October 05, 2015
|
|
|
|
Faster moving MACD indicators applied to DJIA, S&P 500 and NASDAQ are all positive as of today’s close. The criteria to issue our Seasonal MACD Buy Signal have been satisfied. With all three indices confirming, we are now issuing our Seasonal MACD Buy Signal. The “Best Six/Eight Months” have officially commenced.
Buy SPDR DJIA (DIA), SPDR S&P 500 (SPY), PowerShares QQQ (QQQ), and iShares Russell 2000 (IWM). For tracking purposes, these ETFs will be added to the portfolio using their respective average prices on October 6. This price will be calculated by summing the open and close prices and dividing by two. Buy limits for DIA, SPY, QQQ and IWM are initially today’s closing price plus 1%.
Also at this time sell AdvisorShares Ranger Equity Bear (HDGE), iShares 20+ Year Treasury Bond (TLT) and iShares Core US Aggregate Bond (AGG). Cover iShares DJ Transports (IYT) short trade. For tracking purposes, these ETFs will be closed out of the portfolio using their respective average prices on October 6.
Remaining short stock trades in the Almanac Investor Stock Portfolio will also be closed out. Cover Blueknight Energy (BKEP), Lincoln Electric (LECO), Valmont Inds (VMI), Bluebird Bio (BLUE), Cheniere Energy (CQP), Norfolk Southern (NSC), Philip Morris (PM) and Praxair Inc (PX). Iron Mountain (IRM) and McDonalds (MCD) were stopped out on September 16. For tracking purposes, these stock trades will be closed out of the portfolio using their respective average prices on October 6.
The Almanac Investor Stock and ETF Portfolios will be updated to reflect these trades in our next regularly scheduled Alert, Tuesday, October 6, 2015.
|
Market & Seasonal MACD Buy Signal Update: Nearly Time to be Bullish
|
|
By:
By Christopher Mistal
|
October 01, 2015
|
|
|
|
Once again it is that time of the year when we begin to look for our Seasonal MACD Buy Signal and once again there are many nervous traders and investors out there wondering how we could possibly be considering buying now. After all, the market is still correcting (for the first time in nearly four years), the Fed is signaling a rate increase, high yield a.k.a. junk bond yields have risen sharply, auto-giant Volkswagen is under investigation for emission cheating and commodity powerhouse Glencore is apparently on the verge of going under (more than a few sources have suggested as much). Not to mention geopolitical concerns or our presidential election.
There are many valid concerns here and the “wall of worry” is indeed quite tall. However, it is precisely times like now that have historically proven to be excellent buying opportunities. As recent as last year, the market briskly sold off in late-September into October. Our October 21, 2014 Seasonal MACD Buy Signal proved timely. Our October 6, 2011 Buy Signal was even timelier and came just days after S&P 500 completed its last correction of 19.4% (from close to close). Volkswagen, Glencore and even the climb of high yield bonds definitely do make for great headlines, but the likelihood that anyone, or even all three combined, could lead to a recession in the U.S. or across the globe as many fear seems quite small.
Seven years of ZIRP (zero interest rate policy) must have forced yield hungry investors into the high-yield market. It had to; it is what the Fed wanted to happen. At first many were likely reluctant to make the move, but they eventually capitulated and made the move from near-zero yielding, relatively safe assets into the high-yield market sending yields and spreads lower. But now, the Fed is signaling that rates will be rising soon so it only seems natural that anyone uncomfortable in that space is going to begin to move back to where they were before. And why not make the move when high-yield bond prices are still relatively high and yields are low.
Volkswagen is a disaster for shareholders from before the scandal broke. Potentially, they are on the hook for some rather significant fines, but recent history in the corporate world suggests they will come through this relatively unscathed as many criminal and civil suites usually end up being settled for way less than originally discussed. It would seem impossible to prove that all 11 million vehicles (or whatever the number is) with the allegedly illegal software actually polluted at levels above the limit. People have been and will be fired, management will be shaken up, cost-cutting and saving for the eventual settlement has begun. In the end, and in all probability, the company will be hit with a “record-breaking” fine(s) that will be way less than the tens of billions possible, pay it and move on with an even more profitable corporate structure than when the scandal broke.
Glencore has a problem, too much debt, but the holders of the billions of unsecured bonds the company sold over recent years have billions of problem. If Glencore does disappear, so do billions of dollars. It seems most likely that the banks and investors involved will come to a solution that prevents the worst, the death of a mining giant that employs approximately 181,000 people. Besides, did anyone really need Glencore or an analyst that covers them to tell us that commodities have been struggling?
This brings me to the alleged “biggest canary in the coal mine,” the stock market. On a closing basis, the S&P 500 has corrected 12.4% from its high on May 21 to its low on August 25. After four years absent a pullback of this magnitude it is no wonder many are concerned the market is signaling something far worse could be about to materialize. But, just how good of an indicator is the S&P 500? Is it really forecasting a U.S. or global recession in the near future? A look back at S&P 500 past track suggests about a 1 in 3 chance of recession at this point.
First a quick review of definitions. A bear market is defined as a 20% or greater decline in the S&P 500. A correction would be a decline greater than 10% and less than 20%. Based upon these definitions every bear market begins as a correction, but not every correction becomes a bear market. As of today, the S&P 500 is in a correction only.
Since June 15, 1948 there have been 11 S&P 500 bear markets and 23 corrections including the current one. Since the future is unknown, we will exclude the current correction from the tally meaning there have been 33 declines in excess of 10%. However, the National Bureau of Economic Research has only identified 11 recessions over the same time period. This works out to 1 recession out of 3 S&P 500 declines in excess of 10%. One out of three might be great in baseball, but it is not so good elsewhere. Relying solely on the S&P 500 to forecast the next recession is not the best idea as it has been wrong 2 out of 3 times.
Why the decline then? Perhaps the market was simply due. Maybe higher interest rates (or the fear of) caused traders and investors to pull back on margin debt. Valuations were stretched in some areas of the market. Current growth and earnings estimates are also tepid although much of this is the result of commodities tanking and the dollar surging. The demise of commodities and the rise of the dollar are relatively recent events making year-over-year comparisons difficult in many sectors. Provided the dollar and commodities stabilize, comparisons will also normalize in a few quarters which could be anticipated by the market long before it actually happens. Conditions for a rally are not aligned well yet, but they are getting close.
Seasonal MACD Buy Signal Update
Our Seasonal MACD Buy signal can trigger anytime now. Presently, the MACD Buy indicator (MACD (C,8,17,F)) in the following charts of S&P 500 and NASDAQ is negative. DJIA’s MACD indicator eked positive at the close today, but Stochastic and relative strength indicators remain negative.
When MACD indicators for DJIA, S&P 500 and NASDAQ are all positive, we will issue our Seasonal MACD Buy Alert. Until that time we will continue to maintain a defensive posture in our ETF and Stock portfolios.