|
July 2017 Trading & Investment Strategy
|
|
By:
|
June 29, 2017
|
|
|
|
|
Market at a Glance - 6/29/2017
|
|
By:
Christopher Mistal
|
June 29, 2017
|
|
|
|
6/28/2016: Dow 21454.61 | S&P 2440.69 | NASDAQ 6234.41 | Russell 2K 1425.27 | NYSE 11812.80 | Value Line Arith 5563.70
Psychological: Frothy. According to the most recent
Investors Intelligence Advisors Sentiment survey bulls climbed to 54.9% from 51.5% in the prior week, bears slipped to 18.6% and correction declined to 26.5%. Considering DJIA, S&P 500 and Russell 2000 have effectively gone nowhere since March 1, a few percentage points in nearly four months for S&P 500, bullish sentiment this high is excessive and arguably rather overoptimistic. At some point, the market’s patience is likely to runout while it waits for tax reform, healthcare overhaul, defense and infrastructure spending and many other campaign promises that have not yet been delivered.
Fundamental: Fuzzy. Atlanta Fed’s GDPNow model keeps lowering its GDP forecast for Q2 and the IMF also lowered its growth forecast for the U.S. for 2017 and 2018. Healthcare overhaul has not gotten done which is calling into question whether or not other major policy initiatives will ever get done. Not to mention the need for a Federal budget and the looming Federal debt ceiling. It would appear there is a larger than usual number of things Congress could mess up this year.
Technical: Topping? Weekly NYSE Advance/Decline negative three weeks in a row, new NYSE Weekly Highs fading and new NYSE Weekly Lows expanding and major indexes taking turns at fractional new all-time highs all adds you to a stalled rally at best or a significant top at worst. NASDAQ led the charge higher since March 1, but it has faltered and is on the verge of closing below its 50-day moving average. If NASDAQ fails to find support, it will likely pull the rest of the market lower with it.
Monetary: 1.00-1.25%. At its June meeting, the Fed went ahead and raised its key lending rate. Based upon CME Group’s FedWatch Tool, the Fed is most likely done increasing rates until December. Have they sufficiently reloaded for the next economic downturn? Probably not, but within historical context, they are still highly accommodative leaving room for further improvement in the labor market and perhaps even nudging inflation a bit higher. The flattening yield curve is worth keeping an eye on.
Seasonal: Neutral. July is best month of the third quarter for the DJIA and S&P, but performance for the other two months, August and September, makes comparisons easy. Recent “hot” Julys in 2009 and 2010 have boosted July’s average gains since 1950 to 1.2% and 1.0% respectively. In post-election years, July is #1 for DJIA and S&P 500 and #2 NASDAQ, Russell 1000 & 2000, but many of the past “hot” post-election-year Julys were preceded by weak Junes. This has not been the case this year.
|
July Outlook: Market Gone Nowhere Past Month Worst 4 Months Correction Likely
|
|
By:
Jeffrey A. Hirsch & Christopher Mistal
|
June 29, 2017
|
|
|
|
The pesky, eclectic
Three Peaks and a Domed House Top Pattern (3PDH), we updated you on last month at this time persists and is getting closer to rolling over as we enter the teeth of the Worst 4 Months summer doldrums.
The updated 3PDH chart below continues to align with seasonal trouble and waning market readings. We have removed the question mark on point 15 and added points 16-19 and 22 for color and moved 23 to the June 19 high. The pattern is always evolving. If this 3PDH pattern does continue to develop and complete, points 1 through 20 look rather set.
The beginning of the current 3PDH pattern at point 1 (not labeled) corresponds to the points 10-14 of the previous 3PDH’s separating decline. The May 21, 2015 S&P 500 top is point 23 of the last one and point 5 (the middle peak) of the current pattern. And the ultimate bear market low in February 2016 is both point 28 of the last pattern and point 14 of the current 3PDH.
We have also drawn horizontal black lines at 5 big round levels that correspond with various technical support levels with the resultant percentages of what the decline to those levels would be from the recent June 19 high.
The market may hold out through the typical
NASDAQ Midyear Rally through mid-July or even until later this summer, but all of our 5 Market Disciplines in the
Market at a Glance are tuckered out and signaling a market retreat in the near term.
Market psychology is fading and reminds us of the summer of 2015. In the accompanying chart courtesy of our friends at
Investors Intelligence, back in 2015 the difference between bullish advisors and bearish had been in a downtrend as the market moved virtually sideways in a topping process from March to July.
Then the bottom fell out in late-August and stayed down through September until blowing through that low in February 2016 creating a Ned Davis Research defined bear market bottom (DJIA 13% decline after 145 calendar days, peak to trough) with DJIA and S&P 500 down over 14% and NASDAQ down over 18% at the time.
While it’s not precisely the same conditions this time around – seldom is – it is reminiscent, especially considering the seasonally weak time of year is upon us again. We are not expecting Ursa Major, but a decline of 10% or more is quite probable.
Pulse of the Market
After the close on June 9, we issued our
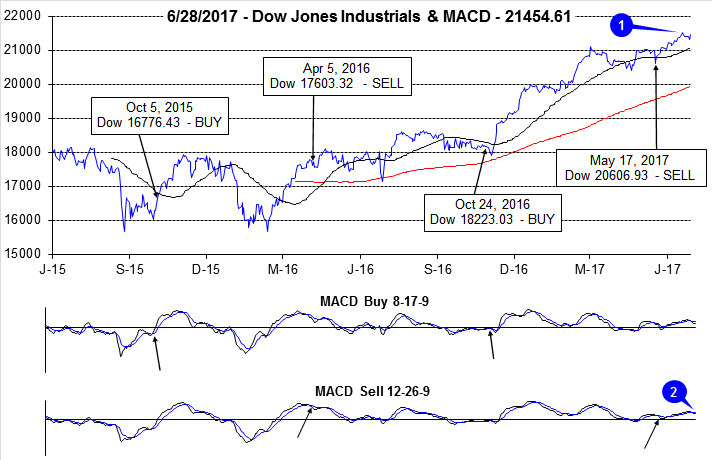
Seasonal MACD Sell signal for NASDAQ. That Alert marked the beginning of the “Worst Four Months,” July through October. And even though DJIA has climbed to new all-time highs this month (1), it has essentially done very little since March 1 when it closed at 21115.55. Nearly four months later, DJIA is barely over 1% higher. In the four months leading up to March 1, DJIA gained better than 17% (Nov 1 through March 1). DJIA appears to be stalling and both the faster and slower moving MACD indicators (2) have issued recent sell signals in confirmation.
Further evidence of a waning rally can be seen in DJIA’s recent weekly performance. DJIA’s best weekly advance was the last full week in May. Weekly gains have been tapering off since then (3). The Down Friday/Down Monday (4) that occurred at the end of May has been completely ignored by the market, thus far. Historically, sometime during the 90 calendar days after a Down Friday/Down Monday occurrence, DJIA has registered a meaningful decline.
S&P 500 (5) and NASDAQ (6) are also showing signs of fatigue. S&P 500 has been up in four of the last five weeks, but the last two weekly gains have been marginal. NASDAQ appears to have switched from leading the market higher to now leading it lower. If it can find and hold support, NASDAQ’s Midyear Rally could still materialize.
NYSE Weekly Advancers and Decliners (7) are also painting an uncertain overall picture. Weekly Advancers have been outnumbered by Weekly Decliners for three straight weeks. If the majority of an index’s components are declining then there is an increasing probability that the index will soon begin to decline.
NYSE Weekly New Highs (8) have also been choppy, peaking at the end of April at 544 while NYSE Weekly New Lows were at their highest level last week since the week ending November 18, 2016. Crude oil’s decline likely contributed to broader energy sector weakness, but for the rally to continue, new lows need to stop climbing and new highs need to begin to expand again.
The spread between the 90-day Treasury Rate and the 30-Year Treasury Rate (9) has declined to its lowest level since early 2008. This flattening of the yield curve is not going to help the major banks and the celebration today about future dividend increases and share buybacks could be short-lived.
|
July Almanac & Vital Stats: Top Month in Post-Election Years
|
|
By:
Christopher Mistal & Jeffrey A. Hirsch
|
June 22, 2017
|
|
|
|
July may be the best performing month of the third quarter, but the mostly negative results in August and September make the comparison easy. Two “hot” Julys in 2009 and 2010 where DJIA and S&P 500 both gained greater than 6% and a strong performance in 2013 have boosted July’s average gains since 1950 to 1.2% and 1.0% respectively. Such strength inevitability stirs talk of a “summer rally”, but beware the hype, as it has historically been the weakest rally of all seasons (page 72, Stock Trader’s Almanac 2017).
July begins NASDAQ’s worst four months and is the third worst performing NASDAQ month since 1971, posting a 0.4% average gain. Dynamic trading often accompanies the first full month of summer as the beginning of the second half of the year brings an inflow of new funds. This creates a bullish beginning, a soft week after options expiration and strength towards the end.
July’s first trading day is the fourth best performing first trading day of all twelve months with DJIA gaining a cumulative 1010.33 points since 1998. Over the past 21 years, DJIA’s first trading day of July has produced gains 81.0% of the time with an average advance of 0.47%. S&P 500 has advanced 85.7% of the time (average gain 0.45%). NASDAQ has been slightly weaker at 76.2% (0.28% average gain). No other day of the year exhibits this amount of across-the-board strength which makes a case for declaring the first trading day of July the most consistently bullish day of the year over the past 21 years.
Trading on the day before and after the Independence Day holiday is often lackluster. Volume tends to decline on either side of the holiday as vacations begin early and finish late. Since 1980, DJIA, S&P 500, and NASDAQ have recorded net losses on the day after. Russell 2000 is negative on the day before and the day after.
Post-election year Julys rank at or near the top of all post-election year months. DJIA and S&P 500: +2.2%, #1 (since 1953); NASDAQ (since 1973): +3.4% and Russell 2000 (since 1981): +3.1% #2. Delving deeper into this data reveled that many of these past “hot” Julys were preceded by a flat or down first half of the year so there is no guarantee that this July will live up to its historical post-election year record again this year.
| July (1950-2016) |
| |
DJI |
SP500 |
NASDAQ |
Russell
1K |
Russell 2K |
| Rank |
|
4 |
|
5 |
|
10 |
|
8 |
|
11 |
| #
Up |
|
42 |
|
37 |
|
24 |
|
18 |
|
18 |
| #
Down |
|
25 |
|
30 |
|
22 |
|
20 |
|
20 |
| Average
% |
|
1.2 |
|
1.0 |
|
0.4 |
|
0.7 |
|
-0.3 |
| 4-Year Presidential Election Cycle Performance
by % |
| Post-Election |
|
2.2 |
|
2.2 |
|
3.4 |
|
3.3 |
|
3.1 |
| Mid-Term |
|
1.1 |
|
0.7 |
|
-2.2 |
|
-1.1 |
|
-4.5 |
| Pre-Election |
|
1.0 |
|
0.9 |
|
0.9 |
|
0.5 |
|
0.3 |
| Election |
|
0.5 |
|
0.4 |
|
-0.7 |
|
0.1 |
|
-0.2 |
| Best & Worst July by % |
| Best |
1989 |
9.0 |
1989 |
8.8 |
1997 |
10.5 |
1989 |
8.2 |
1980 |
11.0 |
| Worst |
1969 |
-6.6 |
2002 |
-7.9 |
2002 |
-9.2 |
2002 |
-7.5 |
2002 |
-15.2 |
| July Weeks by % |
| Best |
7/17/09 |
7.3 |
7/17/09 |
7.0 |
7/17/09 |
7.4 |
7/17/09 |
7.0 |
7/17/09 |
8.0 |
| Worst |
7/19/02 |
-7.7 |
7/19/02 |
-8.0 |
7/28/00 |
-10.5 |
7/19/02 |
-7.4 |
7/2/10 |
-7.2 |
| July Days by % |
| Best |
7/24/02 |
6.4 |
7/24/02 |
5.7 |
7/29/02 |
5.8 |
7/24/02 |
5.6 |
7/29/02 |
4.9 |
| Worst |
7/19/02 |
-4.6 |
7/19/02 |
-3.8 |
7/28/00 |
-4.7 |
7/19/02 |
-3.6 |
7/23/02 |
-4.1 |
| First Trading Day of Expiration Week: 1990-2016 |
| #Up-#Down |
|
18-9 |
|
17-10 |
|
18-9 |
|
16-11 |
|
15-12 |
| Streak |
|
U4 |
|
U4 |
|
U4 |
|
U4 |
|
U4 |
| Avg
% |
|
0.1 |
|
0.001 |
|
0.1 |
|
-0.02 |
|
-0.04 |
| Options Expiration Day: 1990-2016 |
| #Up-#Down |
|
10-15 |
|
11-16 |
|
10-17 |
|
11-16 |
|
8-19 |
| Streak |
|
U1 |
|
D1 |
|
D1 |
|
D1 |
|
U1 |
| Avg
% |
|
-0.5 |
|
-0.5 |
|
-0.6 |
|
-0.5 |
|
-0.6 |
| Options Expiration Week: 1990-2016 |
| #Up-#Down |
|
17-10 |
|
14-13 |
|
13-14 |
|
14-13 |
|
13-14 |
| Streak |
|
U5 |
|
U5 |
|
U3 |
|
U5 |
|
U2 |
| Avg
% |
|
0.4 |
|
0.02 |
|
0.1 |
|
-0.01 |
|
-0.2 |
| Week After Options Expiration: 1990-2016 |
| #Up-#Down |
|
14-13 |
|
13-14 |
|
14-13 |
|
14-13 |
|
11-16 |
| Streak |
|
U1 |
|
U1 |
|
U1 |
|
U1 |
|
U1 |
| Avg
% |
|
-0.1 |
|
-0.2 |
|
-0.5 |
|
-0.2 |
|
-0.4 |
| July 2017 Bullish Days: Data 1996-2016 |
| |
1,
13, 14, 20, 25 |
1,
6, 13, 14, |
1,
7, 11, 13, 14 |
1,
13, 14, 20 |
1, 13, 25, 28 |
| |
|
20,
28 |
19,
20, 25, 28 |
25,
28 |
|
| July 2017 Bearish Days: Data 1996-2016 |
| |
5,
21, 29 |
5,
21 |
5,
21, 29 |
5,
21 |
21, 22 |
| |
|
|
|
|
|
|
July 2017 Strategy Calendar
|
|
By:
Christopher Mistal
|
June 22, 2017
|
|
|
|
|
Stock Trades: A Basket of Shorts for Consideration
|
|
By:
Christopher Mistal
|
June 27, 2017
|
|
|
|
After narrowly bucking the trend of
poor performance during the week after June option expiration week, by a little more than 10 points, DJIA and the rest of the market is stumbling early in the final week of Q2 and the first half. Tech and small-cap were the biggest decliners today as the IMF cut its growth forecast for the U.S. from 2.3% to 2.1% for 2017 and trimmed its 2018 outlook even more, from 2.5% to 2.1%. Debt, labor force participation, a 13.5% poverty rate and the increasing likelihood that meaningful policy changes would not materialize were among some of the main drivers that led to this downtrodden outlook.
If the new administration, the majority party, fails to deliver on promises and growth does not accelerate, then the market could be well ahead of itself. This does not mean a recession and/or bear market is inevitable, it just means a near-term pullback or correction is more likely. It has also been 502 calendar days since the last S&P 500 correction of 10% or more which nearly equals the average duration between corrections since 1950 of 515 days.
When? It could be soon. July is generally a decent month in most years and has a solid history in post-election years, but afterwards, August and September have about nearly the opposite record. Furthermore, trader and investor patience will be even thinner two to three months from now if little or no progress has been made in D.C. Factor in the looming budget battle and impending debt ceiling within the context of the current level of Federal government dysfunction and many of the necessary ingredients are present for a market pullback.
Short Stock Basket
This basket of 14 possible stocks to short spans the three market cap ranges in the Almanac Investor Stock Portfolio. There are two Small-Cap stocks (less than $1 billion), eight Mid-Cap stocks (greater than $1 billion but less than $5 billion) and four Large-Cap stocks (greater than $5 billion in value). Our screening process involved an in-depth review of fundamentals, such as revenues and earnings, valuation metrics like price-to-earnings and price-to-sales ratios, each stock’s technical situation as well as price and daily trading volume. Seasonally weak sectors, like materials, transports and cyclicals were also given extra attention and produced a few of the stocks in the basket.
The broad criteria for inclusion on this list relied primarily on revenues and earnings (past and future estimates). Generally, stocks that are exhibiting decelerating, flat or negative earnings ranked high on our list of short candidates. Out of this trimmed list, stocks with elevated P/E and/or P/S ratios were retained. Finally share price and volume were considered. From a list of several thousand stocks, these 14 remained. A few of these stocks, like Tesla Inc. (TSLA) have solid revenue growth, but profits remain elusive and cash is quickly being consumed. There are worse stocks out there, but many of them had already fallen a substantial distance. Whereas, this basket still appears to offer plenty of downside potential in coming months. Some are trading near 52-week lows while others maybe just a few percentage points off of 52-week highs.
Remain patient as the first half of July is historically bullish, but afterwards the worst-two-consecutive-month span, August through September, begins. Like past short trade ideas, there are two possible prices to consider establishing a short position at. The first is labeled “Short @ Resistance” in the table below. Should a stock rally toward this price then stall and lose momentum a short trade can be considered. Look for corresponding weakness by MACD, Stochastic and relative strength indicators to confirm. The second price to consider shorting the stock is listed in “Short on breakdown below”. This is the stock’s current projected support level. If the stock breaks support a short trade can also be considered. Regardless of short trade entry price, the suggested stop loss is the same initially. All 14 short stock ideas will be tracked in the Almanac Investor Stock Portfolio.
Disclosure Note: At press time, officers of the Hirsch Organization, or accounts they control did not hold any positions in the stocks mentioned, but may buy or sell at any time.
|
Mid-Month Update: Sinking Crude & Worst Four Months
|
|
By:
Christopher Mistal
|
June 20, 2017
|
|
|
|
Historically, this week, the week after June options expirations has been a treacherous week. The week did start off on a positive note with solid across-the-board gains yesterday, but the major indices struggled today to hold those gains. Perhaps today’s weakness was just a touch of profit taking or it’s just the beginning of typical end-of-quarter restructuring. Persistent crude oil weakness was also cited for playing a role in today’s broad declines.
![[Crude oil weekly bars and 1-year seasonal pattern chart]](/UploadedImage/AIN_0717_20170620_CL_Seasonal.jpg)
Typically at this time of the year crude oil would still be enjoying a rally off of its February lows as the North American summer driving season lifts demand and pulls prices higher until sometime in early July (lower pane of above chart highlighted by blue arrows). This has not been the situation this year. Crude oil rallied off a November low to an early January peak just above $55 per barrel. It hung out around that level through early-March before entering its current downtrend. Crude’s losses really accelerated at the start of this month and it traded under $43 per barrel earlier today. Using the standard 20% decline from peak as the rule, crude oil is now in a bear market.
![[Crude oil Daily Bar Chart]](/UploadedImage/AIN_0717_20170620_CL_Daily.jpg)
In the above chart, crude oil’s continuously-linked, non-adjusted, front month futures contract daily price is plotted. It is an ugly chart at this moment, with a series of lower lows and lower highs. It has plunged through projected monthly support (horizontal green dashed line), its 50-day moving average (solid magenta line) has plunged below its 200-day moving average (solid red line) tracing out a bearish death cross and Stochastic, relative strength and MACD indicators are all negative. Crude has not yet broken below its November closing low (solid green line) but could do so any day. The next level of support would be last August’s closing lows right around $39.50 (solid black line).
Crude oil supply is more than ample while demand, at least here in the U.S. appears to be flat at best to lower at worst. There are more alternative energy sources available today than any other time in the past and economies are becoming more efficient with crude’s use, but persistent price weakness could be a warning sign that the global economy is not as strong as it appears. The Atlanta Fed’s
GDPNow model is also showing signs of growth cooling as it now predicts Q2 GDP at 2.9%, down from 3.2% on June 14 and 4.0% on June 1. Slipping Q2 growth expectations could lead to a similar effect on Q2 corporate earnings expectations which in turn could lead to a choppy market in Q3.
Worst Four Months Begin in July
When considering the long-term record (since 1950 for DJIA and S&P 500 and 1971 for NASDAQ), July through October are generally the “Worst Four Months” of the year. In recent years, July and October have been improving while August and September are heading in the opposite direction and now frequently account for the bulk of any market damage. As you can see in the following table, the “Worst Four Months” have been, on average, positive overall since 1950 and are also positive in post-election years over the same time period. However, the average gains are rather paltry considering the fact it is a four-month period and there have also been some rather nasty declines over the years. It is the lack of gains and the susceptibility to significant declines that justifies a cautious, defensive posture in portfolios and even outright avoidance worth considering.
![[Giant Worst Four Months Table]](/UploadedImage/AIN_0717_20170620_Worst_4_Table.jpg)
This next chart better illustrates how DJIA, S&P 500 and NASDAQ have historically performed during the “Worst Four Months” in all years and post-election (PE) years. In all years, the first half of July accounts for virtually all of the markets gains. After this initial jump higher to begin Q3, DJIA, S&P 500 and NASDAQ have all flat-lined, slipping slightly lower by the end of October. Post-election years exhibit a similar pattern, but with full-month July delivering all the gains followed by a more pronounced pullback.
![[Worst Four Months Seasonal Pattern Chart]](/UploadedImage/AIN_0717_20170620_Worst_4_Seasonal.jpg)
NASDAQ’s mid-year rally does appear to be still setting up. Further downside is likely this week followed by a brief beginning of Q3 rally after which the market is looking increasingly susceptible to a more meaningful pullback. With all the confusing cross-current geopolitical goings on, stretched valuations, technical topping patterns, seasonal weakness, fading bullish sentiment, a tightening Fed and a new administration still struggling to advance its policy objectives, the “Worst Four Months” could easily live up to their name.
|
NASDAQ’s Mid-Year Rally Trade Setting Up
|
|
By:
Christopher Mistal
|
June 15, 2017
|
|
|
|
Every year when the days get long and the temperature rises on Wall Street, we always hear those infamous buzzwords, the “Summer Rally.” As volume begins to shrink the hopes for a Summer Rally catch the ear of investors. On page 72 of the 50th Anniversary Stock Trader’s Almanac for 2017 we illustrate that yes, there is a Summer Rally, but there is a rally for all seasons and the one that occurs in summer is the weakest. Yes the market has performed well in a few summers (2013, 2009 & 2003 are some recent notable exceptions), but as a rule it generally does not. Any outsized summer gains have been predominantly due to extenuating circumstances and/or after a sizable correction or bear market.
NASDAQ however, delivers a short, powerful rally that starts at the end of June. The accompanying table shows NASDAQ averaging a 2.4% gain since 1985 during the 12-day period from June’s third to last trading day through July’s ninth trading day. This year the rally could begin around the close on June 27 and run until about July 17.
In the mid-1980s the market began to evolve into a tech-driven market and control in summer shifted to the outlook for second quarter earnings of technology companies. This 12-day run has been up 24 of the past 32 years. After the bursting of the tech bubble in 2000, NASDAQ’s mid-year rally had a spotty track record from 2002 until 2009 with three appearances and five no-shows in those years. However, it has been quite solid over the last seven years, up six times with a single mild 0.1% loss in 2015. Last year, NASDAQ advanced a whopping 9.6% during the 12-day span.
Consistent end-of-Q2 weakness, especially in the week after June’s option expiration week, also contributes to the setup of NASDAQ’s mid-year rally. Any weakness, particularly sharp, brisk declines near the end of June can make great entry points as the first trading day of July is generally strong and the full-month of July is the best month of the third quarter.
In the above chart of PowerShares QQQ (QQQ), this long trade appears to be in the process of setting up once again this year. QQQ is currently just above its 50-day moving average (solid magenta line) and projected monthly support (green dashed line). Stochastic, relative strength and MACD indicators are all negative and trending lower.
QQQ could be considered on dips below $135.95 or when its MACD Buy indicator (8,17,9) issues a buy crossover. If purchased, a 2% trailing stop loss is suggested. Update the stop loss using QQQ’s daily closing price. If not stopped out, take profits at $143.50 or on the close on July 17. This trade will be tracked in the Almanac Investor ETF Portfolio.
|
Stock Portfolio Updates: Tightening Stop Losses
|
|
By:
Christopher Mistal
|
June 13, 2017
|
|
|
|
After taking a backseat to NASDAQ throughout much of April and May, it was DJIA and S&P 500 (and Russell 2000) that closed at new all-time highs today. All three new highs were modestly above their previous records and the across-the-board confirmation by all four indices is still lacking. Based upon the
recent 21-year history of June’s performance and the fact that the market is entering the period where some mid-month strength is common, the market may try to continue to slowly move higher over the next few days, but it will first need to overcome the Fed’s announcement tomorrow.
![[DJIA Daily Bar Chart]](/UploadedImage/AIN_0717_20170613_DJIA.jpg)
![[S&P 500 Daily Bar Chart]](/UploadedImage/AIN_0717_20170613_SP500.jpg)
![[NASDAQ Daily Bar Chart]](/UploadedImage/AIN_0717_20170613_NASDAQ.jpg)
Looking at the three charts above, DJIA and S&P 500 are right around projected monthly resistance (red-dashed line) while their respective Stochastic, relative strength and MACD indicators (lower three panes) are flat-lining. NASDAQ’s chart and technical indicators are more sanguine following last Friday’s rout. Technical indicators stretched and major indices at or near resistance just ahead of typically weak end of June is a near perfect setup that could surprise the bulls.
Stock Portfolio Updates
This past Friday, after the close, we issued our
Seasonal MACD Sell Signal for NASDAQ. With the issuance of this sell signal, the “Best Months” have officially concluded and the “Worst Months” have begun. This does not mean a major selloff is imminent, it merely means the broad market has most likely logged the majority of its gains for now. A few more percentage points higher would not be uncommon, but the time to take some profits, trim weak or underperforming positions, tighten stops and take a more cautious and defensive posture in the portfolios has arrived. But, we will also let our winners continue to run.
In the three and a half weeks since last update, S&P 500 was 3.1% higher while Russell 2000 was up 4.7% as of yesterday’s close. The Almanac Investor Stock Portfolio’s blend of cash and long positions was not as strong, up 1.0% over the same time period excluding dividends and any trading costs. Our Large-Cap portfolio performed best, up 3.5% while Mid-Caps climbed 1.6% and Small-Caps edged 0.2% higher.
Once again, Arista Networks (ANET) was a strong performer over the past three and a half weeks even after taking a sizable hit last Friday. Prior to Friday, shares were trading at new all-time highs, above $158. ANET’s chart is still bullish and its uptrend remains intact. ANET is on Hold and its stop loss has been bumped higher.
UnitedHealth (UNH) also continues to contribute to Large-cap gains. UNH was also recently trading at fresh new highs above $183 per share. Its chart is bullish and healthcare has a solid history of performing well during the “Worst Months.” UNH is on Hold and its stop loss has also been raised.
The Hershey Company (HSY) broke out and bullishly closed above its 50-day moving average and $110 just after last update. HSY has come under some selling pressure this month, but remains close to all-time highs. If HSY can shake off recent weakness and resume its uptrend quickly, then further gains are likely. HSY is on Hold.
Although not reflected in today’s portfolio table (below), Scotts Miracle-Gro (SMG) may have finally broken out of the funk it’s been in since the start of May with a better than 7% gain today. Management did cut its full-year profit and sales outlook, but SMG remains one of the few, well-established names that can be purchased to gain exposure to the rapidly growing cannabis industry. SMG is on Hold.
Regrettably Lydall Inc.(LDL), was stopped out of the Small-cap portfolio on May 19 when it closed below $48.51. LDL was closed out for a gain of 47.4%.
All other positions, not mentioned above, are currently on Hold. Please refer to the updated portfolio table below for Current Advice about each specific position. Please note that some stop losses have been updated.
Disclosure Note: At press time, officers of the Hirsch Organization, or accounts they control held positions in, ANET, BUSE, CCS, HSY, MHO, RMCF and SMG.
|
NASDAQ’s Best Eight Months Update
|
|
By:
Jeffrey A. Hirsch & Christopher Mistal
|
June 09, 2017
|
|
|
|
As of today’s close, both the faster and slower moving MACD indicators applied to NASDAQ have turned negative. At this time we are issuing our official MACD Seasonal Sell signal for NASDAQ.
NASDAQ’s “Best Eight Months” have come to an early end. As a result, Sell iShares DJ US Tech (IYW), SPDR Technology (XLK), iShares Russell 2000 (IWM) and PowerShares QQQ (QQQ). For tracking purposes, these positions will be closed out of the ETF Portfolio using Monday’s average price.
Also, at this time we will add to existing positions in iShares 20+ Year Treasury Bond (TLT), iShares Core US Aggregate Bond (AGG), iShares Silver (SLV) and SPDR Gold (GLD). New buy limits appear below in the updated ETF Portfolio.
This NASDAQ Seasonal Sell Signal is a reminder to tighten stop losses and/or take profits on technology related positions as NASDAQ’s seasonally favorable period has come to an end. Russell 2000 exhibits a similar pattern to NASDAQ an similar precautions can be considered for small-cap holdings.
Disclosure Note: At press time, officers of the Hirsch Organization, or accounts they control held a position in AGG, GLD, IWM, QQQ, SLV, TLT and XLP.
|
NASDAQ’s MACD Update & Seasonal Sector Trades: Softer Dollar Could Give Commodities a Boost
|
|
By:
Christopher Mistal & Jeffrey A. Hirsch
|
June 08, 2017
|
|
|
|
As of the market’s close today, both the faster and slower moving MACD indicators applied to NASDAQ were positive. With NASDAQ’s gain today, a one-day decline of over 1.7% (108.28 points) would be needed to turn NASDAQ’s MACD Sell indicator negative.
When NASDAQ’s MACD Sell indicator becomes negative, we will issue our NASDAQ Seasonal MACD Sell signal and begin clearing out remaining technology and small-cap positions held in the Almanac Investor ETF Portfolio. We will also review current holdings in the Stock Portfolio and take action where needed.
Seasonal Sector Trades
Beef prices tend to form a seasonal high in March as packers have purchased inventory ahead of the summer grilling season. Then as grill masters supplement steaks and burgers with pork ribs, chicken and other delicacies, beef consumption starts to decline in the hot weather. But beef supplies also begin to dwindle as feed lots are short on inventory.
Live Cattle prices typically hit a seasonal low in mid- to late June and then begin to rise before the school season begins as federal government subsidies for school lunch programs kick in for beef purchases. Consumption continues to increase through the winter and holiday season, generally keeping cattle futures prices higher through mid-February.
Our top longer-term seasonal play for live cattle is to go long the April 2018 contract near the usual June low on or about June 20 and hold it for 160 days until early February. Over the past 47 years this trade has been positive 31 times for a success rate of 66.0%. After failing to deliver gains in 2015, this trade returned to profitability last year with a modest gain as live cattle did not reach a bottom until October. More recently, live cattle have been exhibiting strength during its usually weak period. This is typically a bullish sign and when the weaker U.S. dollar is considered, the prospects for another successful trade are further improved. Not to mention the potential effects of China importing U.S. beef later this year.
![[June Long Live Cattle (April 2018) Trade History]](/UploadedImage/AIN_0717_20170608_LC_History.jpg)
The weekly chart below depicts the Live Cattle continuous futures contract with iPath Bloomberg Livestock Sub-TR ETN (COW) overlaid as a solid black line to illustrate how the two instruments trade nearly in tandem. Traders may want to look at futures and options strategies, but others may find COW an adequate trading vehicle. In any event, beef is likely poised for its typical seasonal move up from an early summer low to a mid-winter peak.
![[Live Cattle (LC) Weekly Bars (Pit Plus Electronic Continuous contract) & Seasonal Pattern since 1970]](/UploadedImage/AIN_0717_20170608_LC_Seasonal.jpg)
COW is thinly traded averaging just about 48,000 shares per day on average over the past month, but volume does pickup when Live Cattle (or lean hogs) begin to move. As of April 28, 2017, COW was 63.94% Live Cattle and 36.06% Lean Hogs. Caution should be taken with COW. This Exchange-Traded Note, like other unsecured debt securities with no principal protection, carries inherent risk, primarily issuer credit risk, and the risks with COW may be greater. PLEASE READ THE
PROSPECTUS, CONSULT YOUR FINANCIAL ADVISOR AND CONDUCT YOUR OWN DUE DILIGENCE.
COW could be considered on dips below $25.00. If purchased, a stop loss of $23.35 is suggested. This trade will be tracked in the
Almanac Investor ETF Portfolio.
![[iPath DJ-UBS Livestock Sub-Index ETN (COW) Daily Bar Chart]](/UploadedImage/AIN_0717_20170608_COW.jpg)
In addition to Live Cattle seasonal strength beginning in June, Cocoa, Wheat and Sugar also begin seasonably favorable periods in the month. Outside of the futures market, iPath Pure Beta Cocoa ETN (CHOC), Teucrium Wheat (WEAT) and iPath Bloomberg Sugar ETN (SGG) correlate well. However, trading volumes can be thin and there is another choice available to gain broad exposure. PowerShares DB Agriculture (DBA) is a good alternative as it provides exposure to ten different commodities: Live Cattle, Cocoa, Coffee, Corn, Cotton, Feeder Cattle, Lean Hogs, Soybeans, Sugar and Wheat. DBA has assets in excess of $700 million and trades better than 400,000 shares per day on average, offering plenty of liquidity relative to other choices. DBA could be considered on dips below $20.03. If purchased, a stop loss of $18.99 is suggested. This trade will also be tracked in the ETF Portfolio. DBA, with 17.5% of assets in live cattle is also a reasonable alternative to thinly traded COW.
|
ETF Trades: Natural Gas Weakness Likely to Persist
|
|
By:
Christopher Mistal
|
June 06, 2017
|
|
|
|
With the first five months of 2017 officially in the record books we have updated our 1-Year Seasonal Pattern Charts of Seventh Years of Decades, Post-Election Years, Newly Elected Republican Administrations, All New Elected Administrations and 2017 year-to-date below. As of yesterday’s close, DJIA, S&P 500 and NASDAQ were all within a few percentage points of reaching the historical average highs. All three indices are well above typical Post-Election year performance and the performance of past Newly Elected Republican Administrations. The pattern they appear to be following most closely is that of Seventh Years of Decades. This pattern is heavily influenced by 1987 with a peak in early August for DJIA, late-July for S&P 500 and October for NASDAQ.
![[DJIA Seasonal Chart]](/UploadedImage/AIN_0717_20170606_Seasonal_DJIA.jpg)
![[S&P 500 Seasonal Chart]](/UploadedImage/AIN_0717_20170606_Seasonal_SP500.jpg)
![[NASDAQ Seasonal Chart]](/UploadedImage/AIN_0717_20170606_Seasonal_NASDAQ.jpg)
A repeat of 1987 is not that likely, but some weakness over the coming summer months is expected. Little actual progress has been made with healthcare or tax reform, the Fed is poised to hike rates again and Congress still needs to address the federal debt limit. Any misstep by the Fed or letdown from Washington could easily derail this year’s strong advance.
NASDAQ’s Best Eight Months Update
As of the market’s close today, both the faster and slower moving MACD indicators applied to NASDAQ were positive. With NASDAQ’s modest loss today, a one-day decline of over 1.5% (97.46 points) would be needed to turn NASDAQ’s MACD Sell indicator negative.
When NASDAQ’s MACD Sell indicator becomes negative, we will issue our NASDAQ Seasonal MACD Sell signal and begin clearing out remaining technology and small-cap positions held in the Almanac Investor ETF Portfolio. We will also review current holdings in the Stock Portfolio and take action where needed.
June Sector Seasonalities
June offers just one high-probability seasonal trading opportunity. This trade is based upon the NYSE ARCA Natural Gas index (XNG) and takes advantage of seasonal weakness by natural gas stocks beginning in mid-June through the end of July. XNG has been in a downtrend since peaking in early December of last year and the trend is currently showing no sign of reversing.
First Trust Natural Gas (FCG) has also been in an extended downtrend since last December. Its 50-day moving average bearishly crossed below its 200-day moving average in mid-March. While Stochastic, relative strength and MACD indicators applied to FCG are all negative. FCG could be shorted on any rally up to resistance around $22.00 or on a breakdown below support at $20.34. If shorted, an initial stop loss at $24.15 is suggested.
Ample natural gas supply and healthy inventories are likely to continue to pressure its price and the shares of the companies that explore, develop and produce it are likely to suffer as well. Mild weather conditions are also putting a damper on demand as air conditioners remain idle and their associated electrical demand nonexistent particularly here in the northeast where today’s high did not reach 60 in New York.
ETF Portfolio Updates
In preparation for the end of NASDAQ’s “Best Eight Months,” stop losses have been raised significantly for IYW, XLK, IWM and QQQ. See table below for exact values. When we issue our NASDAQ Seasonal Sell signal, we will close these positions out of the portfolio.
Defensive positions in TLT, AGG, SLV and GLD are on Hold. When we issue NASDAQ’s Seasonal Sell signal we will reevaluate these positions and possibly officially increase the size of these positions.
Recent short trade ideas, IYT, XLF and XLB are around unchanged as of yesterday’s close. IYT is currently showing a 5% loss, but it appears to be failing at resistance. Continue to Hold IYT, XLF and XLB.
Disclosure Note: At press time, officers of the Hirsch Organization, or accounts they control held positions in AGG, FXB, GLD, IWM, QQQ, SLV, TLT, XLE and XLP.
|
NASDAQ “Best Eight Months” Update: A/D Line Trouble
|
|
By:
Christopher Mistal
|
June 01, 2017
|
|
|
|
Tomorrow morning the May jobs report will be released. Earlier today, ADP’s National Employment Report showed private sector employment increased 253,000 (seasonally adjusted) while the median forecast for tomorrow’s report is 185,000 according to data available at
MarketWatch.com. Solid numbers tomorrow would confirm the U.S. labor market remains on reasonably firm ground.
Over the past sixteen years, the market has not responded favorably on June’s jobs report day. DJIA has advanced seven times while S&P 500, NASDAQ and Russell 1000 have advanced just six times on the day. Russell 2000 has the best record with eight advances and eight declines Average losses range from 0.46% for DJIA to 0.62% for NASDAQ. If tomorrow’s number beats expectations, then the market could easily overcome its recent poor track record.
NASDAQ Seasonal Sell Signal Status
Although the “Best Six Months” for DJIA and S&P 500 have officially come to an end, NASDAQ’s “Best Eight Months” (November through June) is still in progress. As of the market’s close yesterday, both the faster and slower moving MACD indicators applied to NASDAQ were positive. With NASDAQ’s modest gain today, a one-day decline of over 1.3% (81.49 points) would be needed to turn NASDAQ’s MACD Sell indicator negative.
When NASDAQ’s MACD Sell indicator becomes negative, we will issue our NASDAQ Seasonal MACD Sell signal and begin clearing out remaining technology and small-cap positions held in the Almanac Investor ETF Portfolio. We will also review current holdings in the Stock Portfolio and take action where needed.
In the meantime we will enjoy the rally while it lasts. It is not uncommon for the market to continue to rally after we issue our Seasonal MACD Sell Signal for DJIA and S&P 500. However, past rallies have been of limited duration and often just a few percentage points of additional gains. (Yes, there have been exceptions such as 2013’s QE fueled summer rally) This strength has been an excellent opportunity to begin to wind down long exposure ahead of frequently turbulent August and September.
Even though DJIA, S&P 500 and NASDAQ all closed at new all-time highs today, there is at least one worrisome sign that trouble could be brewing. Market breadth is not as robust as would be expected. The NYSE Composite Advance/Decline line along with S&P 500’s Advance/Decline line are trending higher and are at or near highs, but NASDAQ’s and Russell 2000’s Advance/Decline lines are not in clear uptrends nor near highs. If the majority of an index’s components are not advancing, it stands to reason that at some point the index will also stop advancing. If NASDAQ’s leadership breaks down, then there could easily be a typical summer pullback or correction.