|
January Barometer 2019 Official Results: January Trifecta Up 3-For-3 Bullish for 2019
|
|
By:
Jeffrey A. Hirsch
|
January 31, 2019
|
|
|
|
Most major U.S. stock indexes rallied to new recovery and year-to-date highs today shrugging off some misses and weakness from Microsoft, DuPont and Visa. S&P 500 finished the month strong with a 7.9% gain. This is the best S&P January since 1987. This is also the third January Trifecta in a row.
Last year the S&P 500 crumbled in the fourth quarter under the weight of triple threats from a hawkish and confusing Fed, a newly divided Congress and the U.S. trade battle with China, finishing in the red. 2017’s Trifecta was followed by a full-year gain of 19.4%, including a February-December gain of 17.3%. As you can see in the table below, the long term track record of the Trifecta is rather impressive, posting full-year gains in 27 of the 30 prior years with an average gain for the S&P 500 of 17.1%.
Devised by Yale Hirsch in 1972, the January Barometer has registered ten major errors since 1950 for an 85.5% accuracy ratio. This indicator adheres to propensity that as the S&P 500 goes in January, so goes the year. Of the ten major errors Vietnam affected 1966 and 1968. 1982 saw the start of a major bull market in August. Two January rate cuts and 9/11 affected 2001.The market in January 2003 was held down by the anticipation of military action in Iraq. The second worst bear market since 1900 ended in March of 2009 and Federal Reserve intervention influenced 2010 and 2014. In 2016, DJIA slipped into an
official Ned Davis bear market in January. Including the eight flat years yields a .739 batting average.
Our January Indicator Trifecta combines the Santa Claus Rally, the First Five Days Early Warning System and our full-month January Barometer. The predicative power of the three is considerably greater than any of them alone; we have been rather impressed by its forecasting prowess. This is the 31st time since 1949 that all three January Indicators have been positive and the twelfth time (previous eleven times highlighted in grey in table below) this has occurred in a pre-election year.
With the Fed turning more dovish and President Trump tacking to the center and meeting with China and market internals improving along with the gains, the market is tracking Base Case and Best Case scenarios outlined in our
2019 Annual Forecast. Next eleven month and full-year 2019 performance is expected to be more in line with typical Pre-Election returns.
|
Market at a Glance - 1/30/2019
|
|
By:
Christopher Mistal
|
January 31, 2019
|
|
|
|
1/30/2019: Dow 25014.86 | S&P 2681.05 | NASDAQ 7183.08 | Russell 2K 1486.94 | NYSE 12222.39 | Value Line Arith 5947.29
Psychological: Neutral. According to
Investor’s Intelligence Advisors Sentiment survey bulls are at 45.8%. Correction advisors are at 33.6% and Bearish advisors are 20.6%. At current levels, sentiment is essentially flat. Bearish and correction advisors combined outnumber bullish advisors, but not by a significant margin which leaves room for further gains. The pace of gains is likely to cool if bullish sentiment continues to rise.
Fundamental: Firm-ish. Near-term outlook remains fair. Unemployment is low, the economy is still creating jobs each month, corporate earnings, although slowing, are forecast to continue growing and Atlanta Fed’s GDPNow model is forecasting 2.7% growth for Q4 (official first reading for Q4 is still delayed). There has been an uptick in initial weekly jobless claims, but some of the increase is typical for January as part-time holiday help is let go. Housing and autos are a soft area of the U.S. economy. Stabilizing interest rates could bring some improvement to these markets. Warmer weather may also help.
Technical: Recovering. DJIA, S&P 500, NASDAQ and Russell 2000 have all rallied briskly after bottoming on the day before Christmas. Relative strength, Stochastic and MACD indicators are all positive, but stretched. An early December death cross remains on the charts. Indexes are back above their respective 50-day moving averages but further gains are needed to reclaim their 200-day moving averages.
Monetary: 2.25-2.50%. Patient is the new word from the Fed as it quickly changed course and established a much more dovish stance. What took so long is anyone’s best guess. Inflation appears just about perfectly under control while growth is forecast to cool, not run away. A pause in tightening seems to align well with incoming data and that is likely what will happen this year which could prove to be bullish for stocks.
Seasonal: Bullish. February’s long-term track record is mixed. In all years February ranks no better than seventh. However, in pre-election years, February’s performance generally improves with average returns all turning positive. NASDAQ performs best, gaining an average 2.8% in pre-election-year Februarys since 1971. Russell 2000 is second best, averaging gains of 2.5% since 1979. DJIA, S&P 500 and Russell 1000, the large-cap indices, tend to lag with average advances of around 1.0%.
|
February Outlook: Market Internals Support Rally & Solid 2019 Gains
|
|
By:
Jeffrey A. Hirsch & Christopher Mistal
|
January 31, 2019
|
|
|
|
After spending much of the day deeper in the red, the Dow ended the day fractionally lower, but still managed to post a 7.2% gain for the month – not only its best monthly gain in the past three months, but its best January since 1989. S&P 500 added to its 2019 gains today outpacing the Dow with a 7.9% gain for the month – its best January since 1987, scoring our third January Indicator Trifecta in a row. Further details on the bullish implications of the January Indicator Trifecta appear in the accompanying “
January Barometer 2019 Official Results” article that is part of today’s alert.
NASDAQ stocks racked up even better gains than Dow and S&P posting a 9.4% gain for January, its best January since 2001. However, the Russell 2000 Index of small cap stocks was the star of the month beating all the major U.S. indices with a whopping January gain of 11.2%, its best January since 1987. This is also reassuring as small caps have a long history of outperforming large caps in the month of January, known as the “January Effect.” Small Caps outperforming in January suggest a healthy market exhibiting normal bullish behavior.
This phenomenon was first identified by the economist and investment banker Sidney Wachtel in his 1942 paper “Certain Observations on Seasonal Trends in Stock Prices” in the Journal of Business published by the University of Chicago press. Mr. Wachtel studied and tracked the seasonal movements of the stock market and is believed to have coined the term “January Effect.”
Market internals, compiled below in the “Pulse of the Market” show the market likely found at least an interim low on December 24, 2018 with the highest Weekly CBOE Equity Only Put/Call Ratio since January 2016 registering 0.92 on December 21, the Friday before the “Christmas Eve Crumble.” This contrary sentiment indicator often spikes near the 1.00 level or higher at major lows as investors and traders buy protective puts en masse.
Additional support can be seen in the Advance-Decline Line, New Highs and Lows as well as market performance in and of itself. The “Christmas Eve Crumble” also appears to be the culmination of textbook, back-to-back Down Friday/Down Monday bottom. Weekly Advancers, Decliners, New Highs and New Lows all hit rather extreme levels throughout December especially the week ending December 21. But keep the 2008-2009 bear market bottom in the back of your mind and remain on alert for a retest. Internals were weakest and at extreme levels in November 2008, yet the market made its ultimate low in March 2009 on stronger internals.
At this point the market appears to be more on track with our Base and Best Case scenarios from our December 20, 2018
2019 Annual Forecast. Fed Chairman Jerome Powell is sounding much more dovish now and the FOMC left interest rates unchanged yesterday. In addition to leaving interest rates unchanged, the market was pleased to hear the Fed express flexibility on its balance reduction strategy, patience with increasing rates further and data dependence. In his official remarks after the FOMC meeting Powell himself said, “
The case for raising rates has weakened somewhat.” Long time readers will remember we have been suggesting this for months.
The prospects for 2019 have improved dramatically over the past five weeks. The Fed has removed its blinders and backed off its unwavering stance to raise rates and reduce its balance on a rapid pace. President Trump has begun to tack to the center a hair with the Dems and the Chinese. If that continues and his adversaries reciprocate prospects for our Best Case scenario for 2019 improve.
Lastly, after the late Midterm Year correction, more normal
Pre-Election Year gains are now likely in 2019. The Pre-Election Year or 3rd Year of the 4-Year Election Cycle is the best of the 4 by a wide margin. DJIA averages 15.8% since 1949 and NASDAQ Composite averages 28.8% since 1971.
Pulse of the Market
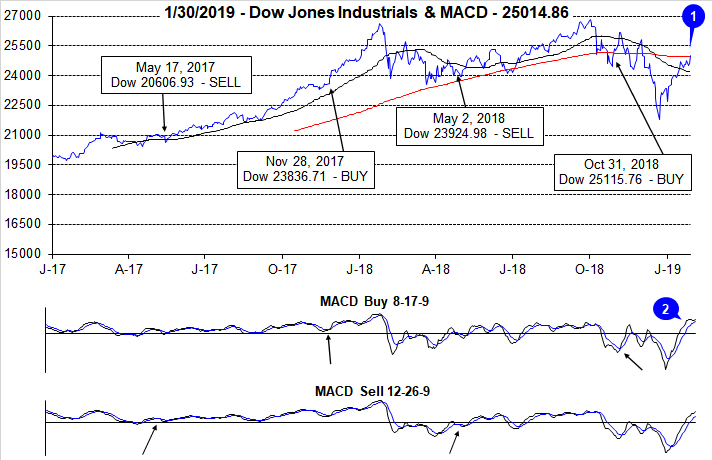
Since bottoming on the day before Christmas, DJIA’s trajectory has been essentially straight back up. Santa paid a visit to Wall Street and thus the Santa Claus Rally was positive. The First Five Days were also positive. These early January indicator’s positive readings foreshadowed full-month gains and a positive January Barometer. Three positive January indicators complete the Trifecta which improves the prospects of further gain this year. DJIA has reclaimed its 50-day moving average, but currently appears to be having an issue with its 200-day moving average (1). Climbing back above this level would further enhance the bullish argument. DJIA’s waning positive momentum is confirmed by its slower moving MACD indicator (2).
A DJIA Dow Friday/Down Monday (DF/DM) did occur mid-January (3), but thus far there has been no real significance as the broad rally continued. Following three straight weekly declines in December, DJIA and NASDAQ (5) has recorded five straight weekly gains. S&P 500 has been up in four of the past five weeks (4).
Market breath measured by NYSE Weekly Advancers and NYSE Weekly Decliners has been bullish since late December with Advancers outnumbering Decliners by wide margins in four of the last five weeks (6). Last week’s mixed performance (DJIA and NASDAQ slightly positive, S&P 500 slightly negative) was accompanied by a somewhat neutral Advance/Decline ratio.
Weekly New Lows spiked to their highest number since November 2008 in mid-December at 1648. Weekly New Highs nearly fell into the single-digits then. Since then, Weekly New Lows have retreated significantly while Weekly New Highs expanded slightly (7). Major indexes are currently around the mid-point between their respective December lows and recent all-time highs so New Highs and New Lows are likely to remain somewhat subdued.
Short- and long-term interest rates (8) appear to be stabilizing. The 90-day Treasury rate has been right around 2.35% since early November and the 30-year Treasury has been right around 3.00% for the last six weeks. Where rates go from here largely depends on how well the U.S. economy holds up and how the Fed reacts.
Click for larger graphic…
|
February Almanac: Generally a Tepid Month for Large Caps
|
|
By:
Jeffrey A. Hirsch & Christopher Mistal
|
January 24, 2019
|
|
|
|
Even though February is right in the middle of the Best Six Months, its long-term track record, since 1950, is not all that stellar. February ranks no better than seventh and has posted paltry average gains except for the Russell 2000. Small cap stocks, benefiting from “January Effect” carry over; tend to outpace large cap stocks in February. The Russell 2000 index of small cap stocks turns in an average gain of 1.1% in February since 1979—just the seventh best month for that benchmark.
In pre-election years, February’s performance generally improves with average returns all positive. NASDAQ performs best, gaining an average 2.8% in pre-election-year Februarys since 1971. Russell 2000 is second best, averaging gains of 2.5% since 1979. DJIA, S&P 500 and Russell 1000, the large-cap indices, tend to lag with average advances of around 1.0%.
The first trading day is bullish for DJIA, S&P 500 and NASDAQ. Average gains on the first day over the last 21-year period are right around 0.5%. Strength then tends to fade after that until the stronger eighth, ninth and eleventh trading days. Expiration week had a spotty longer-term record but has been improving recently. The week after also had a clear negative bias that appears to be fading even though averages losses remain across the board for the past 29 years.
Presidents’ Day is the lone holiday that exhibits weakness the day before and after (Stock Trader’s Almanac 2019, page 88). The Friday before this mid-winter three-day break can be treacherous and average declines persist for three trading days after the holiday going back to 1980.
| February (1950-2018) |
| |
DJI |
SP500 |
NASDAQ |
Russell
1K |
Russell 2K |
| Rank |
|
8 |
|
9 |
|
7 |
|
9 |
|
7 |
| #
Up |
|
41 |
|
38 |
|
26 |
|
24 |
|
23 |
| #
Down |
|
28 |
|
31 |
|
22 |
|
16 |
|
17 |
| Average
% |
|
0.2 |
|
0.04 |
|
0.7 |
|
0.3 |
|
1.1 |
| 4-Year Presidential Election Cycle Performance
by % |
| Post-Election |
|
-1.1 |
|
-1.5 |
|
-3.3 |
|
-1.3 |
|
-1.6 |
| Mid-Term |
|
0.7 |
|
0.5 |
|
0.7 |
|
0.8 |
|
1.4 |
| Pre-Election |
|
1.2 |
|
1.1 |
|
2.8 |
|
1.5 |
|
2.5 |
| Election |
|
-0.1 |
|
0.1 |
|
2.5 |
|
0.3 |
|
2.2 |
| Best & Worst February by % |
| Best |
1986 |
8.8 |
1986 |
7.1 |
2000 |
19.2 |
1986 |
7.2 |
2000 |
16.4 |
| Worst |
2009 |
-11.7 |
2009 |
-11.0 |
2001 |
-22.4 |
2009 |
-10.7 |
2009 |
-12.3 |
| February Weeks by % |
| Best |
2/1/08 |
4.4 |
2/6/09 |
5.2 |
2/4/00 |
9.2 |
2/6/09 |
5.3 |
2/1/91 |
6.6 |
| Worst |
2/20/09 |
-6.2 |
2/20/09 |
-6.9 |
2/9/01 |
-7.1 |
2/20/09 |
-6.9 |
2/20/09 |
-8.3 |
| February Days by % |
| Best |
2/24/09 |
3.3 |
2/24/09 |
4.0 |
2/11/99 |
4.2 |
2/24/09 |
4.1 |
2/24/09 |
4.5 |
| Worst |
2/10/09 |
-4.6 |
2/10/09 |
-4.9 |
2/16/01 |
-5.0 |
2/10/09 |
-4.8 |
2/10/09 |
-4.7 |
| First Trading Day of Expiration Week: 1990-2018 |
| #Up-#Down |
|
19-10 |
|
22-7 |
|
18-11 |
|
22-7 |
|
20-9 |
| Streak |
|
U4 |
|
U5 |
|
U5 |
|
U5 |
|
U5 |
| Avg
% |
|
0.3 |
|
0.3 |
|
0.2 |
|
0.3 |
|
0.2 |
| Options Expiration Day: 1990-2018 |
| #Up-#Down |
|
15-14 |
|
13-16 |
|
11-18 |
|
13-16 |
|
14-15 |
| Streak |
|
U2 |
|
U2 |
|
D1 |
|
U2 |
|
U5 |
| Avg
% |
|
-0.1 |
|
-0.2 |
|
-0.3 |
|
-0.2 |
|
-0.1 |
| Options Expiration Week: 1990-2018 |
| #Up-#Down |
|
18-11 |
|
17-12 |
|
17-12 |
|
16-17 |
|
20-9 |
| Streak |
|
U4 |
|
U4 |
|
U5 |
|
U9 |
|
U9 |
| Avg
% |
|
0.5 |
|
0.3 |
|
0.3 |
|
0.3 |
|
0.5 |
| Week After Options Expiration: 1990-2018 |
| #Up-#Down |
|
13-16 |
|
14-15 |
|
17-12 |
|
14-15 |
|
15-14 |
| Streak |
|
U3 |
|
U3 |
|
U5 |
|
U3 |
|
U1 |
| Avg
% |
|
-0.4 |
|
-0.3 |
|
-0.3 |
|
-0.2 |
|
-0.1 |
| February 2019 Bullish Days: Data 1998-2018 |
| |
1,
13, 15 |
1,
12, 13, 15 |
1,
13, 14, 15, 26 |
1,
12, 13, 15, 26 |
1, 6, 12-14, 19 |
| |
|
|
|
|
26, 27 |
| February 2019 Bearish Days: Data 1998-2018 |
| |
4,
28 |
28 |
5,
28 |
28 |
5, 28 |
| |
|
|
|
|
|
|
February 2019 Strategy Calendar
|
|
By:
Christopher Mistal
|
January 24, 2019
|
|
|
|
|
Stock Portfolio Update: A Welcome Lift from Free Lunch Basket
|
|
By:
Jeffrey A. Hirsch & Christopher Mistal
|
January 17, 2019
|
|
|
|
Charles Dow is known as the father of technical analysis and his Dow Theory has instilled in us all the relevance and importance of market price and volume action to the analysis of financial markets and the allocation of investment portfolios and trading accounts. But perhaps its high time Dow Theory was modernized and brought into the 21st Century of trading and investing.
As the creators Stock Trader’s Almanac and champions of market cycles, patterns and seasonality we have had to change with the times over our past 52 years on The Street. Our market probability calendar has changed dramatically over the years, most notably by the mid-month spike. We’ve built on the January Barometer, First Five Days and Santa Claus Rally indicators by combing them into the January Indicator Trifecta. Adding MACD-timing to the Best Six Months has also been a boon. There is more…
The concept of Dow Theory is still quite sound: technical confirmation across correlated industries or major segments of the market economy. We are big fans of confirmation. We are especially fond of seasonal or cyclical trading patterns that are confirmed over multiple time frames: long, short and intermediate.
With all the recent near term bearish sentiment and the chatter about the big Dow Theory sell signal since the Dow Jones Transportation Average posted a confirming new low with thought it prudent to examine this closer.
Referring the “Gross Output by Industry” data as of 2018 Q2 on the St. Louis Fed’s excellent data base you can see that the services industry is about two thirds (65%) of the U.S. economic output while “goods-producing” industries are about 25% of the economy. (Government accounts for the rest.) The “transportation and warehousing” industry account for a mere 3.4% and “manufacturing” is 13.7%.
So how can such a small portion of the current economy still be deemed a leading indicator? Utilities are a paltry 1.4% of the economy, but at least everyone and everything uses energy. Think back to early 2016 when we had our last Dow Theory sell signal. Industrials and Transports made new lows but not Utilities. Perhaps confirmation from Healthcare or Financials should be considered. In any event, it’s probably time to revisit this century-old indicator.
Stock Portfolio & Free Lunch Update
Over the last six weeks since last update, S&P 500 declined 1.3% through yesterday’s close. Russell 2000 was 0.04% lower over the same time frame. Overall, the entire Stock Portfolio jumped 7.3% excluding any dividends or trading fees. The small-cap portion of the portfolio was responsible for all the gains in the overall portfolio, leaping 14.6% due to the success of our Free Lunch basket. Mid-caps slipped a modest 1.8%, but also benefited from some exposure to Free Lunch positions. Large-caps performed the worst, off 6.9%. There were no large-cap positions included in Free Lunch.
Our Free Lunch strategy is a short-term trade using a different set of guidelines than the rest of the
Almanac Investor Stock Portfolio. Those guidelines were provided
with the portfolio and reiterated in the
first email Alert of the year. We do not anticipate holding Free Lunch positions much longer and will likely have exited most of them by the time mid-February arrives.
This year’s Free Lunch has outperformed the NYSE Comp and NASDAQ by a wide margin since the open on December 24. The entire basket, including closed positions, through yesterday’s close was up an average 25.5% compared to gains of 7.9% for NYSE Comp and 11.1% for NASDAQ. NYSE-listed positions have enjoyed the largest gains, up 34.0% on average. NASDAQ positions have also done well, up 21.8%.
Free Lunch positions can be identified in the portfolio based upon a “Presented Date” of December 24, 2018 and are also shaded in grey in the table below. Remaining Free Lunch positions are on Hold. We will continue to employ the suggested 8% trailing stop loss, updated daily using each position’s respective close. It appears that as long as the broader market remains firm, Free Lunch positions could also continue to perform.
Outside of the Free Lunch basket defensive positions established in June of last year did weaken with the broader market in the second half of December of last year but have proven to be somewhat resilient as many are still holding onto respectable double-digit gains. Church & Dwight (CHD) is now the best performing defensive position from the June 14, 2018 basket. At yesterday’s close CHD was up 35.5%. The former leader, McCormick & Company (MKC) has slipped into the number two spot with a 31.7% gain.
Regrettably, November’s stock basket proved less than timely and many of the positions in that basket have been stopped out. Brooks Automation (BRKS), Kemper Corp (KMPR), US Ecology (ECOL), CDW Corp (CDW) and Plains All American (PAA) were closed out at various times over the last six weeks as they closed below their respective stop losses. First Busey Corp (BUSE), the second longest holding in the portfolio, was also closed out of the portfolio in mid-December.
All positions in the portfolio are on Hold. Should market volatility subside we will consider unwinding remaining defensive positions and entering new long positions. Please see portfolio table below for Current Advice and Stop Losses.
|
ETF Trades: Colder Temps Could Boost Natural Gas
|
|
By:
Christopher Mistal
|
January 10, 2019
|
|
|
|
As of today’s close, DJIA is up 2.9% year-to-date, S&P 500 is up 3.6% and NASDAQ is up 5.3%. Not bad for today being just the seventh trading day of the year. Even more impressive are the gains from since the closing low on December 24th. DJIA and S&P 500 are up over 10% and NASDAQ is up 12.8%. These gains combined with a trend of reduced market volatility suggest the worst of the market’s rout could be over and a return to more typical market behavior during the “Best Months” is underway.
![[DJIA Daily Bar Chart]](/UploadedImage/AIN_0219_20190110_DJIA.jpg)
![[S&P 500 Daily Bar Chart]](/UploadedImage/AIN_0219_20190110_SP500.jpg)
![[NASDAQ Daily Bar Chart]](/UploadedImage/AIN_0219_20190110_NASDAQ.jpg)
Technically, much damage still remains on the charts of DJIA, S&P 500 and NASDAQ, but some healing has taken place. DJIA, S&P 500 and NASDAQ have all rebounded back above support that we put around the old lows from earlier in the first quarter of 2018. The next hurdle will be climbing back above respective 50-day moving averages (magenta solid lines) and eventually back above 200-day moving averages (red solid line). NASDAQ is closest to its 50-day moving average and has been leading the move higher. If NASDAQ breaks through its 50-day moving average, then S&P 500 and DJIA are likely to follow.
January Trade Idea
Based upon the NYSE ARCA Natural Gas Index (XNG) there is a seasonal tendency for natural gas companies to enjoy gains from the end of February through the beginning of June. Detailed in the Stock Trader’s Almanac 2019 on page 92, this trade has returned 13.8%, 14.1%, and 15.6% on average over the past 15, 10, and 5 years respectively.
One of the factors for this seasonal price gain is consumption driven by demand for heating homes and businesses in the cold weather northern areas in the United States. In particular, when December and January are colder than normal, we see drawdowns in inventories through late March and occasionally into early April. This has a tendency to cause price spikes lasting through mid-April and beyond.
This winter got off to a slow start in the Northeast with relatively mild temperatures lasting until now, but the forecast appears to be changing with much colder temperatures appearing. Natural gas prices had spiked above $4.50/mmBtu back in November, but quickly retreated to under $3/mmBtu at the start of January. The situation appears to be setting up well for a rebound in natural gas and the stocks of companies that supply it.
First Trust Natural Gas (FCG) is an excellent choice to gain exposure to the company side of the natural gas sector. FCG could be bought on dips below $16.65. Once purchased, consider using an initial stop loss of $15.40 and take profits at the auto sell, $21.17. Top five holdings by weighting as of yesterday’s close are: EQT Corp, Continental Resources, EnCana Corp, Devon Energy Corp and Cabot Oil & Gas Corp. The net expense ratio is reasonable at 0.6% and the fund has approximately $100 million in assets.
United States Natural Gas (UNG) could be considered to trade the commodity’s seasonality as its assets consist of natural gas futures contracts and is highly liquid with assets of nearly $300 million and trades millions of shares per day. Its total expense ratio is 1.30%. UNG could be bought on dips below $24.60. If purchased, set an initial stop loss at $22.76.
ETF Portfolio Updates – Getting Back on the Horse
After the worst fourth quarter performance by S&P 500 since 2008 and the worst December since 1931, the Almanac Investor Sector Rotation Portfolio was completely wiped out. From S&P 500’s September closing high until its closing low on December 24, it declined 19.8%, just missing the widely utilized 20% decline that defines a bear market. A broad decline of that magnitude dragged all positions in the portfolio below their respective stop losses, even defensive positions like SPDR Healthcare (XLV) and SPDR Consumer Staples (XLP) were not spared.
December’s market rout is somewhat reminiscent of January 2016, only deeper. In February of 2016, recognizing that that sell off was likely overdone and global growth concerns were likely overblown we elected to jump back into positions and it paid off. With this in mind, along with the fact that the Best Six/Eight Months still have at least another three and five months to go respectively we are going to look to re-enter many of the positions that were stopped out. With the exception of Biotech, most favorable sector seasonalities continue until May, June or July. This window of time should provide ample opportunity for positions to recover and appreciate in price. Updated buy limits, stop losses and auto-sell prices can be found in the table below. Please note all buy limits are slightly below current levels.
Tactical Switching Strategy Update
Our Tactical Seasonal Switching Strategy officially does not employ a stop loss (although we have utilized them in the past). As a result, the four positions held in the portfolio endured the wild ride down and are now recovering. Overall the portfolio is down 5.5% from our November 1 purchase date, but this is well above the lows. Now that the major indices have reclaimed their respective support levels and volatility appears to be cooling, we will look to add to our existing positions in DIA, IWM, QQQ and SPY at current prices or better. Buy limits appear in the following table.
|
First Five Days Positive—Horizon Brightens
|
|
By:
Jeffrey A. Hirsch & Christopher Mistal
|
January 08, 2019
|
|
|
|
Solid across the board gains today lifted S&P 500 to a year-to-date gain of 2.7% at today’s close and thus our First Five Day (FFD) early warning system is also positive. Combined with last week’s positive Santa Claus Rally (SCR), our January Trifecta is now two for two. The January Trifecta would be satisfied with a positive reading from our January Barometer (JB) at month’s end.
![[S&P 500 January Early Indicator Trifecta Table]](/UploadedImage/AIN_0219_20190108_Trifecta_Table_FFD.jpg)
The best case, most bullish scenario is when all three indicators, SCR, FFD and JB, are positive (in table above). In 30 previous Trifecta occurrences since 1950, S&P 500 advanced 86.7% of the time during the subsequent eleven months and 90.0% of the time for the full year. However, a January Indicator Trifecta does not guarantee the year will be bear or correction free. Of the four losing “Last 11 Mon” years, shaded in grey in the above table, 1966, 1987 and 2011 experienced short duration bear markets (2011, S&P 500 –19.4% peak to trough). In 2018, S&P 500 retreated 19.8% from its September high close to its December low close.
Even if S&P 500 was to suddenly reverse course and finish the full month in the red, the prospects for the next eleven months and the full year remain fair. Of the last 10 years since 1950 that the SCR and FFD were both positive (and the full-month January was negative), the next eleven months advanced 80% of the time and full year advanced 70% of the time with gains of 7.4% and 2.9% respectively.
A positive SCR and FFD are encouraging and further clarity will be gained when the January Barometer (page 16, STA 2019) reports at month’s end. A positive January Barometer would further boost prospects for full-year 2019. The December Low Indicator (2019 STA, page 34) should also be watched with the line in the sand at DJIA’s December Closing Low of 21792.20 on 12/24/18.
|
2018 Free Lunch Update: 4X Market Return
|
|
By:
Christopher Mistal
|
January 08, 2019
|
|
|
|
As a reminder, our “Free Lunch” (page 112 of Stock Trader’s Almanac 2019) strategy is a short-term trade that takes advantage of several yearend and New Year phenomena. Our research has shown that NYSE stocks making new 52-week week lows in mid-December, primarily due to yearend tax-loss selling, tend to outperform the NYSE through mid-February. These stocks are selected ahead of the Santa Claus Rally (page 114 STA19) and approximately near the start of the January Effect (page 110 STA19).
Many of the stocks selected for the “Free Lunch” trade are down for good reason. Declining revenue and shrinking profits are most common amongst these names while others may have run into legal or accounting trouble. Once a name pops, profits should be taken and conversely if a name continues lower it should be cut loose quickly.
Overall, this year’s basket is handily outperforming the NYSE Comp. Following the guidelines issued with the basket, the basket had a 21.5% average gain at yesterday’s close compared to 5.2% for the index. Over four times the performance of the NYSE Comp over the same time period. On average, NYSE-listed stocks are performing best, up 23.6% (including closed positions). NASDAQ listed stocks, the largest portion of the list, are also performing well, up 20.6% on average.
All of these stocks were added to the Almanac Investor Stock Portfolio using suggested guidelines for buy limits and stop losses. Due to the strict 8% trailing stop loss, updated daily using the position’s closing price, nine positions have been stopped out already. This basket appears to have some life left in it. We will officially continue to hold the remaining open positions in the Stock Portfolio with the previously mentioned 8% trailing stop loss. A complete update of the Almanac Investor Stock and ETF Portfolios will be posted in our next regularly scheduled Alert on Thursday, January 10, emailed after the close.
|
Santa Claus Rally Results: S&P 500 Gains 1.3%
|
|
By:
Jeffrey A. Hirsch & Christopher Mistal
|
January 03, 2019
|
|
|
|
As defined in the Stock Trader’s Almanac, the Santa Claus Rally (SCR) is the propensity for the S&P 500 to rally the last five trading days of December and the first two of January an average of 1.3% since 1950.
The lack of a rally can be a preliminary indicator of tough times to come. This was certainly the case in 2008 and 2000. A 4.0% decline in 2000 foreshadowed the bursting of the tech bubble and a 2.5% loss in 2008 preceded the second worst bear market in history.
Despite another rough day of trading, S&P 500 did finish the seven-day trading span defined by the Santa Claus Rally with a 1.3% gain. Including this year, Santa has paid Wall Street a visit 55 times since 1950. Of the previous 54 occasions, January’s First Five Days (FFD) and the January Barometer (JB) were both up 30 times. When all three indicators were positive, the full year was positive 27 times (90.0%% of the time) with an average gain of 17.1% in all years.
A positive SCR is encouraging and further clarity will be gained when January’s First Five Days Early Warning System (page 14, STA 2019) gives its reading next week and when the January Barometer (page 16, STA 2019) reports at month’s end. A positive First Five Days and January Barometer would certainly boost prospects for full-year 2019. The December Low Indicator (2019 STA, page 34) should also be watched with the line in the sand at the Dow’s December Closing Low of 21792.20 on 12/24/18.
|
Our “January Barometer” Still Highly Relevant & Useful
|
|
By:
Jeffrey A. Hirsch & Christopher Mistal
|
January 03, 2019
|
|
|
|
Devised by Yale Hirsch in 1972, the January Barometer (JB) has registered ten major errors since 1950 for an 85.5% accuracy ratio. This indicator adheres to propensity that as the S&P 500 goes in January, so goes the year. Of the ten major errors Vietnam affected 1966 and 1968. 1982 saw the start of a major bull market in August. Two January rate cuts and 9/11 affected 2001.The market in January 2003 was held down by the anticipation of military action in Iraq. The second worst bear market since 1900 ended in March of 2009 and Federal Reserve intervention influenced 2010 and 2014. In 2016, DJIA slipped into an official Ned Davis bear market in January. Last year, 2018, became the tenth major error overall and the seventh since 2001 as a hawkish Fed, a trade war and slowing global growth concerns resulted in the worst fourth quarter performance by S&P 500 since 2008. Including the eight flat years yields a .739 batting average.
As the opening of the New Year, January is host to many important events, indicators and recurring market patterns. U.S. Presidents are inaugurated and present State of the Union Addresses. New Congresses convene. Financial analysts release annual forecasts. Residents of earth return to work and school en mass after holiday celebrations. On January’s second trading day, the results of the official Santa Claus Rally are known and on the fifth trading day the First Five Days early warning system sounds off, but it is the whole-month gain or loss of the S&P 500 that triggers our January Barometer.
And yet for some reason, every February or sooner if January starts off poorly our January Barometer gets raked over the coals and every attempt at disparaging this faithful indicator comes up lame. It never ceases to amaze us how our intelligent and insightful colleagues, that we have the utmost professional respect for and many of whom we consider friends, completely and utterly miss the point and argue the shortcomings of the January Barometer. However, this year we are not waiting until this happens again. Instead, here is why the January Barometer is still relevant and important.
1933 “Lame Duck” Amendment—Why JB Works
Many detractors refuse to accept the fact the January Barometer exists for one reason and for one reason only: the Twentieth “Lame Duck” Amendment to the Constitution. Passage of the Twentieth Amendment in 1933 created the January Barometer. Since then it has essentially been “As January goes, so goes the year.” January’s direction has correctly forecasted the major trend for the market in many of the subsequent years.
Prior to 1934, newly elected Senators and Representatives did not take office until December of the following year, 13 months later (except when new Presidents were inaugurated). Defeated Congressmen stayed in Congress for all of the following session. They were known as “lame ducks.”
Since 1934, Congress convenes in the first week of January and includes those members newly elected the previous November. Inauguration Day was also moved up from March 4 to January 20.
January’s prognostic power is attributed to the host of important events transpiring during the month: new Congresses convene; the President gives the State of the Union message, presents the annual budget and sets national goals and priorities.
These events clearly affect our economy and Wall Street and much of the world. Add to that January’s increased cash inflows, portfolio adjustments and market strategizing and it becomes apparent how prophetic January can be. Switch these events to any other month and chances are the January Barometer would become a memory.
JB vs. All
Over the years there has been much debate regarding the efficacy of our January Barometer. Skeptics never relent and we don’t rest on our laurels. Disbelievers in the January Barometer continue to point to the fact that we include January’s S&P 500 change in the full-year results and that detracts from the January Barometer’s predicative power for the rest of the year. Others attempt to discredit the January Barometer by going further back in time: to 1925 or 1897 or some other year.
After the Lame Duck Amendment was ratified in 1934 it took a few years for the Democrat’s heavy congressional margins to even out and for the impact of this tectonic governing shift to take effect. In 1935, 1936 and 1937, the Democrats already had the most lopsided Congressional margins in history, so when these Congresses convened it was anticlimactic. Hence our January Barometer starts in 1938.
In light of all this debate and skepticism we have compared the January Barometer results along with the full year results, the following eleven months results, and the subsequent twelve months results to all other “Monthly Barometers” using the Dow Jones Industrials, the S&P 500 and the NASDAQ Composite.
Here’s what we found going back to 1938. There were only 11 major errors. In addition to the ten major errors detailed above: in 1946 the market dropped sharply after the Employment Act was passed by Congress, overriding Truman’s veto, and Congress authorized $12 billion for the Marshall Plan.
Including these 11 major errors, the accuracy ratio is 86.4% for the 81-year period. Including the 9 flat year errors (less than +/– 5%) the ratio is 75.3% — still effective. For the benefit of the skeptics, the accuracy ratio calculated on the performance of the following 11 months is still solid. Including all errors — major and flat years — the ratio is still a respectable 67.9%.
Now for the even better news: In the 50 up Januarys there were only 4 major errors for a 92.0% accuracy ratio. These years went on to post 15.7% average full-year gains and 11.4% February-to-December gains.
Let’s compare the January Barometer to all other “Monthly Barometers.” For the accompanying table we went back to 1938 for the S&P 500 and DJIA — the year in which the January Barometer came to life — and back to 1971 for NASDAQ when that index took its current form.
The accuracy ratios listed are based on whether or not the given month’s move — up or down — was followed by a move in the same direction for the whole period. For example, in the 81 years of data for the S&P 500 for the January Barometer, 61 years moved in the same direction for 75.3% accuracy.
The Calendar Year ratio is based on the month’s percent change and the whole year’s percent change; i.e., we compare December 2017’s percent change to the change for 2017 as a whole. By contrast the 11-month ratio compares the month’s move to the move of the following eleven months. February’s change is compared to the change from March to January. The 12-month change compares the month’s change to the following twelve months. February’s change is compared to the change from March to the next February.
Though the January Barometer is based on the S&P 500 we thought it would clear the air to look at the other two major averages as well. You can see for yourself in the table that no other month comes close to January in forecasting prowess over the longer term.
There are a few interesting anomalies to point out though. On a calendar year basis DJIA in January is slightly better than the S&P. 2011 is a perfect example of how the DJIA just edges out for the year while the S&P does not. For NASDAQ April, September and November stick out as well on a calendar year basis, but these months are well into the year, and the point is to know how the year might pan out following January, not April, September or November. And no other month has any basis for being a barometer. January is loaded with reasons.
Being the first month of the year it is the time when people readjust their portfolios, rethink their outlook for the coming year and try to make a fresh start. There is also an increase in cash that flows into the market in January, making market direction even more important. Then there is all the information Wall Street has to digest: The State of the Union Address, FOMC meeting, 4th quarter GDP, earnings and the plethora of other economic and market data.
Myths Dispelled
In recent years new myths and/or areas of confusion have come to light. One of the biggest errors is the notion that the January Barometer is a stand alone indicator that can be used to base all of your investment decisions for the coming year on. This is simply not true and we have never claimed that the January Barometer should or could be used in this manner. The January Barometer is intended to be used in conjunction with all available data deemed relevant to either confirm or call into question your assessment of the market. No single indicator is 100% accurate so no single indicator should ever be considered in a vacuum. The January Barometer is not an exception to this.
Another myth is that the January Barometer is completely useless. Those that believe this like to point out that simply expecting the market to be higher by the end of the year is just as accurate as the January Barometer. Statistically, they are just about right. In the 81-year history examined in this article, there were only 24 full-year declines. So yes, the S&P 500 has posted annual gains 70.4% of the time since 1938. What is missing from this argument is the fact that when January was positive, the full year was also positive 86.0% of the time and when January was down the year was down 58.1% of the time. These are not the near perfect outcomes that true statisticians prefer, but once again, the January Barometer was not intended to be used in a vacuum.
January Indicator Trifecta
Combining our three January indicators, the Santa Claus Rally (SCR), First Five Days (FFD) and January Barometer (JB), into the January Trifecta has proven to be an especially reliable gauge for future market performance. When all three are positive, as was the case in 2017 and 2018, the next eleven months have been up 86.7% of the time with an average gain of 12.1% and the full year advanced 90.0% of the time with an average S&P 500 gain of 17.1%.